


 1847 Ellamae Place
homes for sale vs a month of sales
About 1.7 months of detached supply.
Oregon Data Share · detached single-family · neighborhood. homes for sale vs a month of sales: 10 homes for sale vs 6 sales a month (1.7 months). Months of supply = active listings divided by average monthly closings over the last 6 months (homes closed in the last 6 months divided by 6). 4 months of supply or less is a seller's market, above 4 and under 6 is balanced, 6 or more is a buyer's market. About 35 closed sales over six months. · as of Sep 14, 2026 · updated Sep 13, 2026
New listings · Orchard District
 $895K647 Lafayette Avenue3 bd · 2 ba · 1,420 sqft$765K1847 Ellamae Place4 bd · 3 ba · 2,292 sqft
 $595K825 Wiest Way3 bd · 2 ba · 1,627 sqft
 $850K714 10th Street5 bd · 3 ba · 3,431 sqft
The alert covers all of Bend, Orchard District included.
See the newest Orchard District listings
4 houses: regional MLS through Oregon Data Share, Market Truth new listings in the last 30 days for Orchard District (detached single-family; Coming Soon excluded). The alert follows this page's filter, which is wider than houses alone. · updated Sep 14, 2026
sold in the last 90 days
Every active and pending listing of every property type on the regional MLS through Oregon Data Share inside the recorded boundary of Orchard District. The wash is sales density of closes in the last 90 days; homes for sale and pending stay as marks. Pulses and the sold count are the closes of the last 30 days. Counts and medians cover every listing read for this map. The map outlines the 81 places with a recorded boundary; listings outside them are counted and drawn as dots with no outline to tap. Roads, rivers and lakes: US Census TIGER/Line 2024, drawn in this map's own projection.
Price
Any price
28 homes on this map, $225K–$2.1M · Orchard District
Bend · all
Oregon Data Share, read live for this map frame — the 28 active listings this view returned. The range is the lowest and highest ask among the 25 of them that publish a whole-property price — a fractional share and a commercial lease rate are withheld; the band is the middle half of the 21 that also publish a price per square foot.
1847 Ellamae Place647 Lafayette Avenue714 10th Street 1240 11th Street
 1530 6th Street
 1401 10th Street
 920 Norton Avenue
 930 Norton Avenue
 2813 North Pilot Butte Drive
 1050 Butler Market Road
 408 Hawthorne Avenue
 2566 Keats Drive
 2981 Roxy Place
 636 Irving Avenue
 1050 Butler Market Road
 2245 Shepard Road
 1050 Butler Market Road
 2640 8th Street
 190 Irving Avenue
 671 Greenwood Avenue
 671 Greenwood Avenue
 671 Greenwood Avenue
 1208 4th Street
Listing data comes from Oregon Data Share and Morgan Data Shuttle. Information deemed reliable but not guaranteed.
Orchard District · Subdivisions
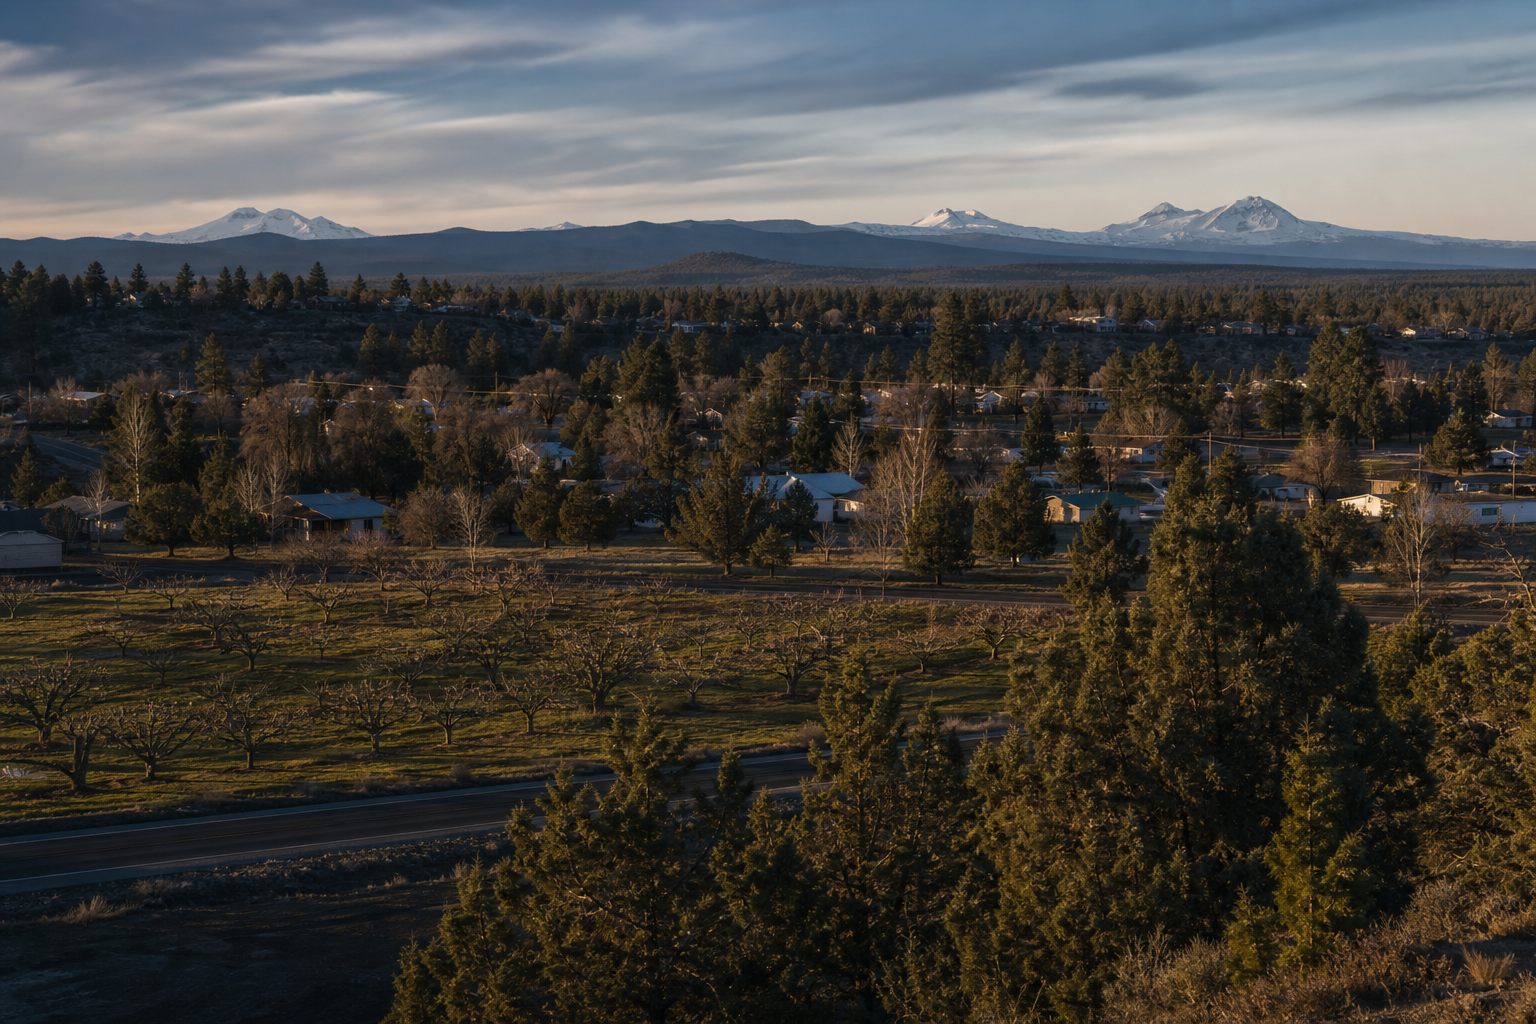
 1st Addition Bend Pk$935,000 median list2 active
live MLS through Oregon Data Share, active single-family listings, counted per place; other property types are that subdivision's own counted segments, the same rows its page prints
Orchard District · What it costs
The middle single-family home for sale in Orchard District asks $715,000. Move either number below and the other one follows.
Principal and interest only. Taxes, insurance and any HOA sit on top.
Between $100,000 and $1,970,000 on the slider. Type any number in the box.
Down payment
Length of the loan
6.76% is the published 30-year fixed (fred:MORTGAGE30US) for the week of Sep 14, 2026. Put your own quote in if you have one.
$3,714 a month reaches $715,000 in Orchard District.
At $715,000, here is what you bring and what you borrow.
Hover, tap or tab a bar for what it counts.
Arithmetic on the price you set, not a figure we measured: 20% down, 6.76%, 30 years. The two add up to $715,000 exactly — closing costs are not in either bar.
Your monthly number against the middle of Orchard District.
Each bar gives up what it counts.
Median asking price $715,000,, the single-family homes for sale inside Orchard District's recorded boundary, the same population this page's own count prints, over 15 homes for sale, read on this page's last refresh. The two payments are principal and interest only, on the terms you set: 20% down, 6.76%, 30 years. Taxes, insurance and any HOA sit on top.
How people actually paid for a house in Orchard District.
Each bar gives up what it counts.
market_metric financing_mix, Orchard District detached closed sales, 12-month window widened by the metric registry's ladder where a place is thin. Shares under 5% are not published, so these do not add to 100%. This is how OTHER buyers paid; it is not a suggestion about your down payment.
Your own numbers, run through the payment math this site uses everywhere (lib/mortgage.ts): 20% down, 6.76%, 30 years. The starting rate is the published 30-year fixed (fred:MORTGAGE30US) published for the week of Sep 14, 2026, read from market_history_weekly. Median asking price $715,000,, the single-family homes for sale inside Orchard District's recorded boundary, the same population this page's own count prints, over 15 homes for sale, read on this page's last refresh. Nothing here is a loan offer or an approval.
Orchard District · Daily life
Orchard District · Bend
Orchard District sits in central-northeast Bend, in the area residents and the city call Midtown. The neighborhood association's own map draws the boundary from Pilot Butte on the east to the BNSF railroad and the US-97 Parkway on the west, with Franklin Avenue as the south edge and Butler Market Road as the north. That puts most of the neighborhood about a mile from downtown, close enough that the NE 6th Street Neighborhood Greenway, one of Bend's first, carries cyclists and walkers the length of the district from Greenwood Avenue to Butler Market Road on calmed streets with speed humps and marked crossings instead of a painted bike lane on a busy arterial.
Orchard District · Housing stock
Eight in ten detached homes in Orchard District were built between 1948 and 2008, based on 1,780 homes with a recorded build year.
Since September 2023, 260 detached listings here reported whether the home has an HOA. 23 of them do.
23 detached listings here reported a dues figure since September 2023. The median is $75 a month.
Every figure here describes detached homes only, measured from listings in the regional MLS. Listings that reported nothing about an HOA are not counted either way. Confirm dues and governing documents through the association before relying on them.
This week · Bend
Open houses scheduled in the next 7 days, live from the MLS through Oregon Data Share
Guides and news
Orchard District · By the numbers
Each answer carries the one figure it is about and where that figure came from. Figures are read from the regional MLS through Oregon Data Share. Market data updated September 2026.
Orchard District has 1.7 months of supply, which is a seller's market. 4 months of supply or less is a seller's market, above 4 and under 6 is balanced, 6 or more is a buyer's market.
Months of supply is how long it would take to sell every home on the market here at the pace homes have actually been selling. Fewer months means buyers are competing; more means they can take their time.
regional MLS, detached single-family homes inside the Orchard District boundary, months of supply is the 10 listings this layer counts as active divided by the last six months of closings divided by six, updated September 2026
The median sale price for a single-family home in Orchard District was $637,000 over the past 12 months.
The homes on the market right now are asking a median of $715,000, which is a different set of homes from the ones that sold.
regional MLS, detached single-family homes inside the Orchard District boundary, median closed price over the past 12 months, updated September 2026
Half the Orchard District homes that went under contract in the last 90 days did it inside 21 days.
Across Bend the median over the same window was 25 days.
regional MLS, detached single-family homes inside the Orchard District boundary, median days from listing to under contract, last 90 days, updated September 2026
The typical Orchard District home closed at 96.4% of the price it was first listed at, over the last 12 months.
Across Bend it was 97.0%.
Under 100% means sellers here generally came down from their first number before the home sold. Over 100% means buyers bid past it.
regional MLS, detached single-family homes inside the Orchard District boundary, median closed price as a share of the original list price, last 12 months, updated September 2026
19.7% of the homes that closed in Orchard District over the last 12 months were paid for in cash.
Across Bend it was 27.6%. A high cash share is why a financed offer here often needs to be stronger somewhere else.
regional MLS, detached single-family homes inside the Orchard District boundary, share of closings recorded as cash, last 12 months, updated September 2026
15 single-family homes are on the market in Orchard District right now.
The supply verdict above divides 10, not this 15. That ratio counts the homes the market layer assigns to Orchard District by place membership; this count is the homes inside its recorded boundary. Two honest counts of two populations, and neither is a correction of the other.
the recorded Orchard District boundary, single-family homes in a publicly active MLS status at the last sync
61 single-family homes closed in Orchard District over the past 12 months.
regional MLS, detached single-family homes inside the Orchard District boundary, closed sales over the past 12 months, updated September 2026
Give us your street address and we will send back a written valuation for it: the number, the comparable sales, and what we would list at.
We build it on the 61 single-family homes that closed in Orchard District over the past 12 months, plus what your home has that those did not.
Start a valuationregional MLS, detached single-family homes inside the Orchard District boundary, closed sales over the past 12 months, updated September 2026
Bend · Other neighborhoods
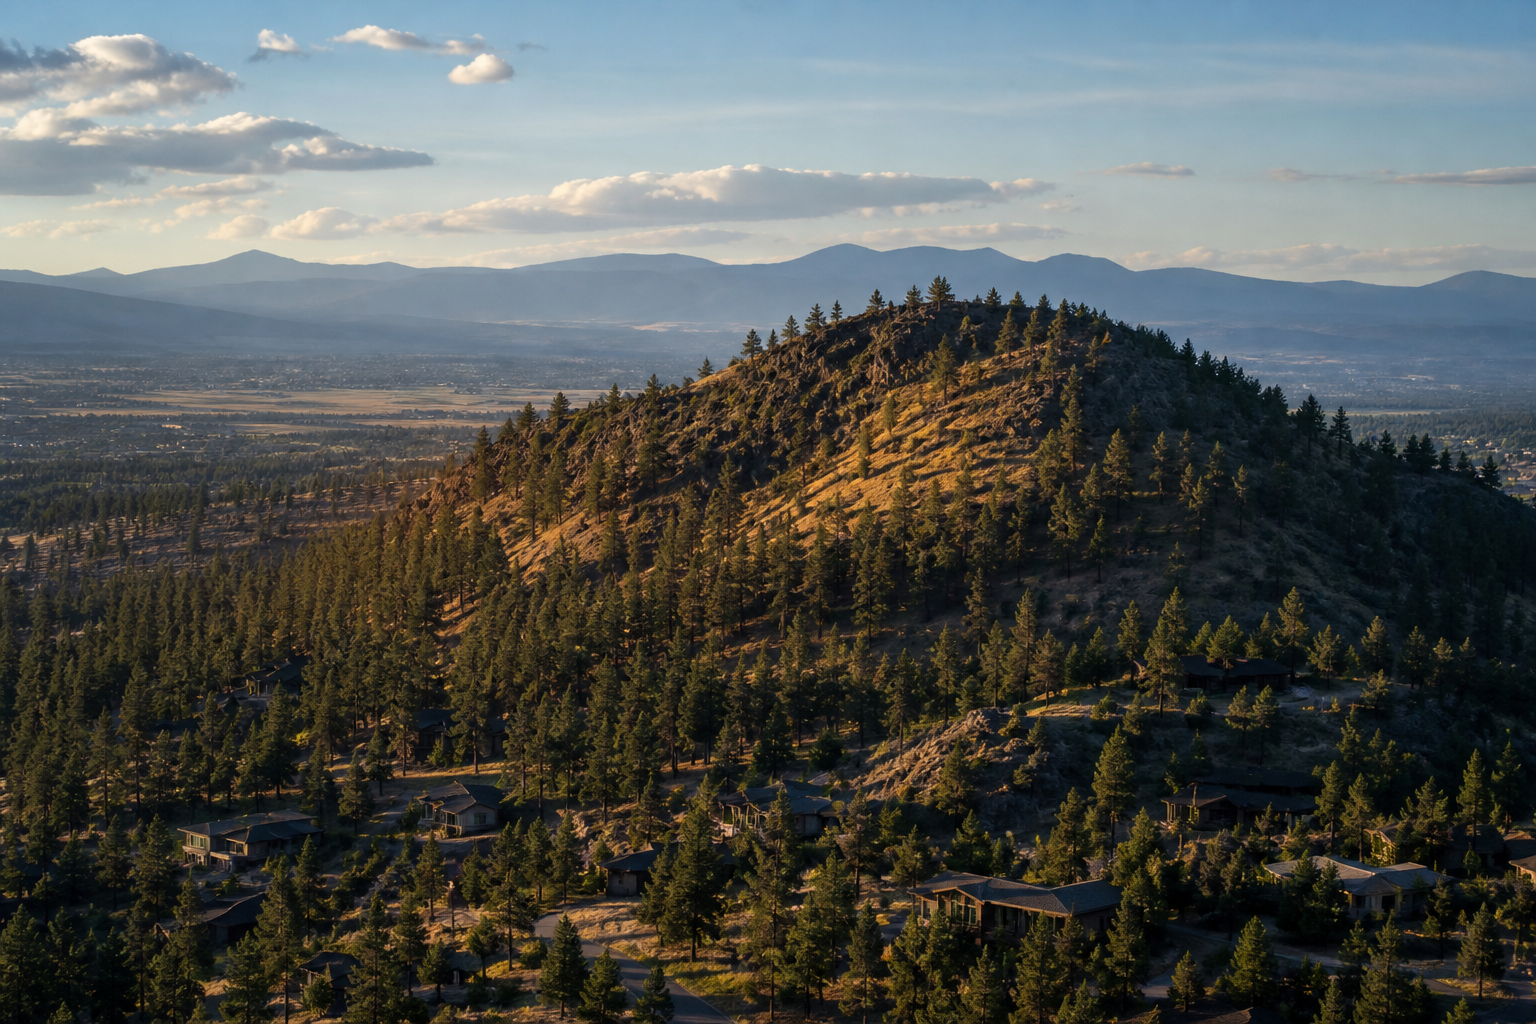 Awbrey Butte$1,299,999 median list55 active
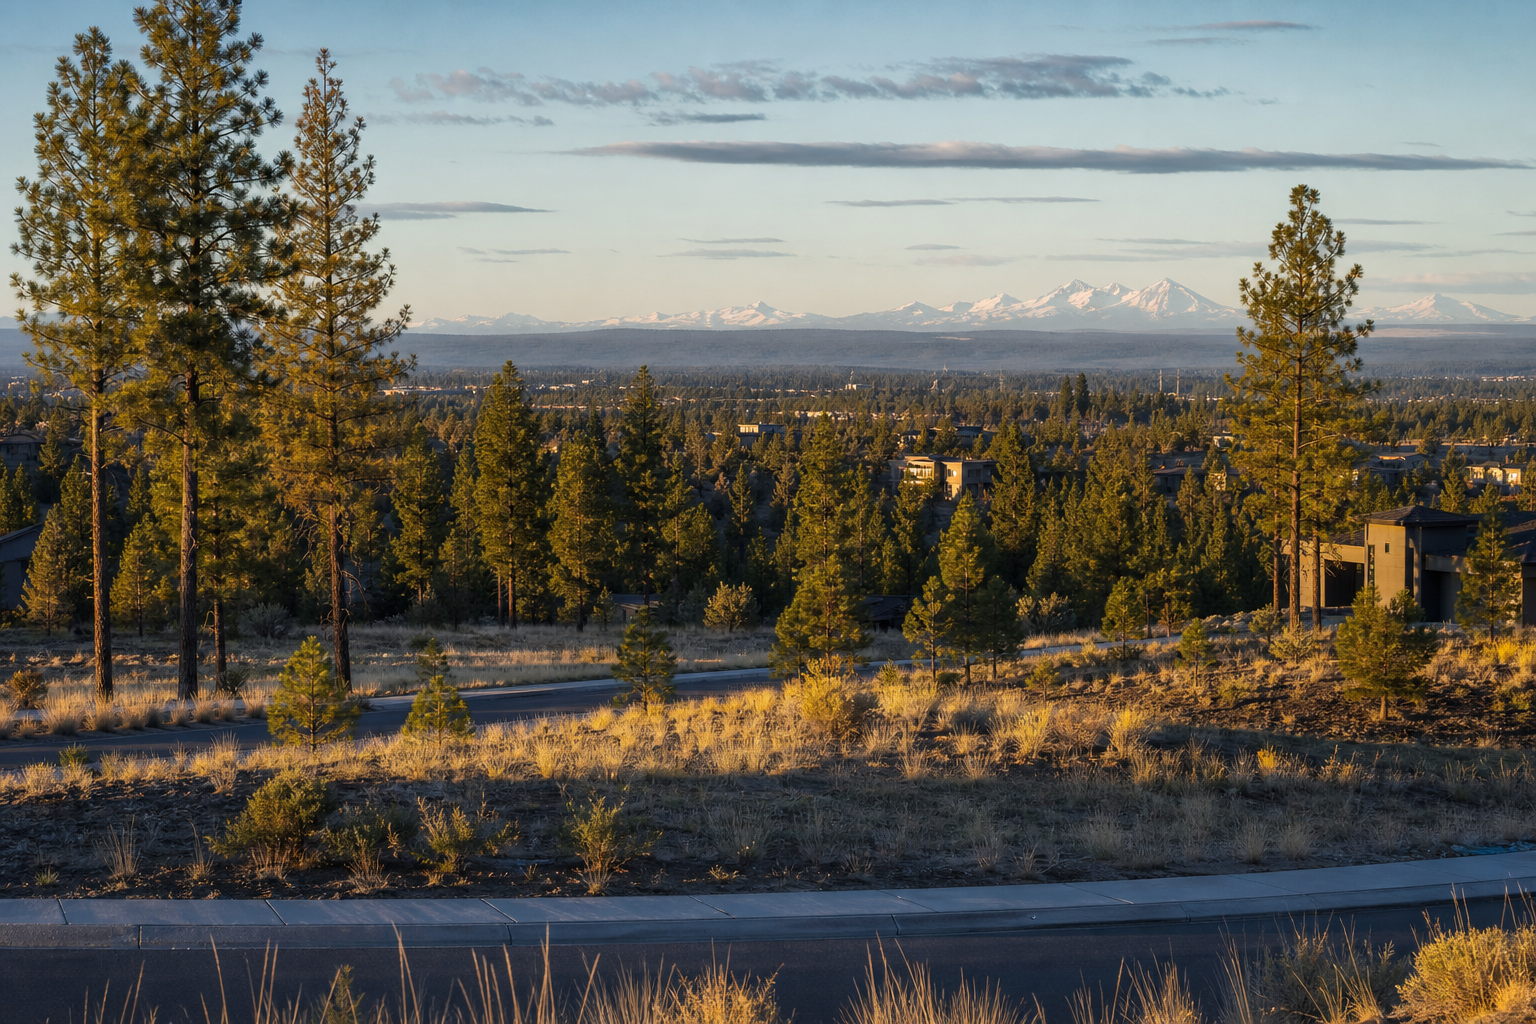 Boyd Acres$599,000 median list47 active
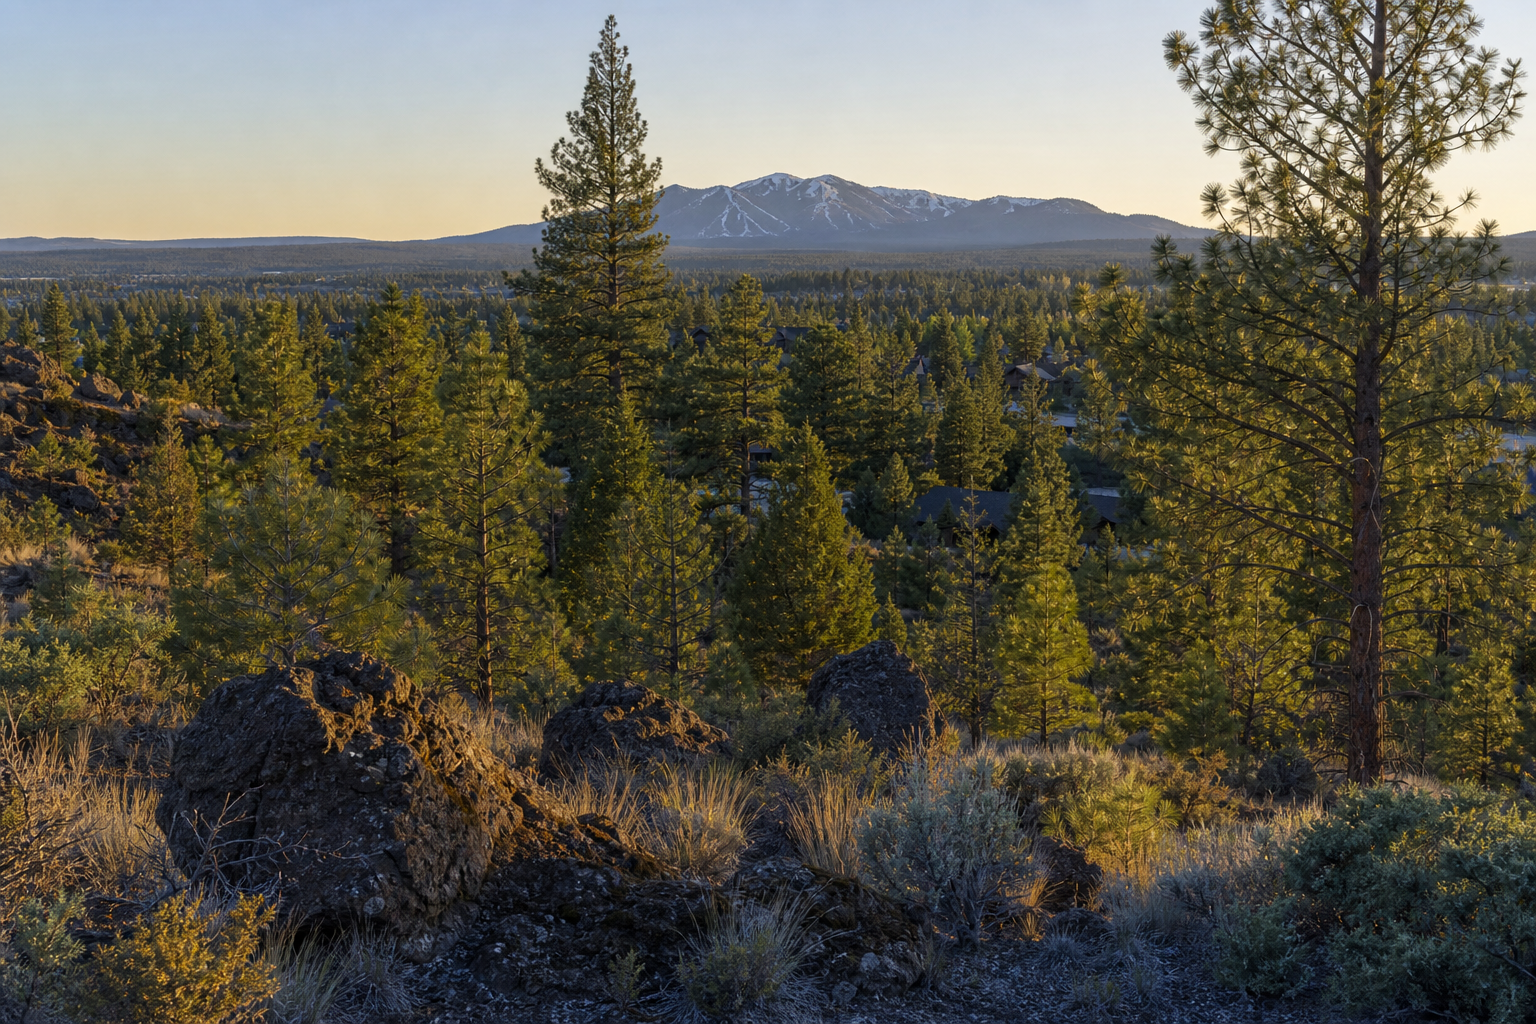 Century West$1,749,000 median list21 active
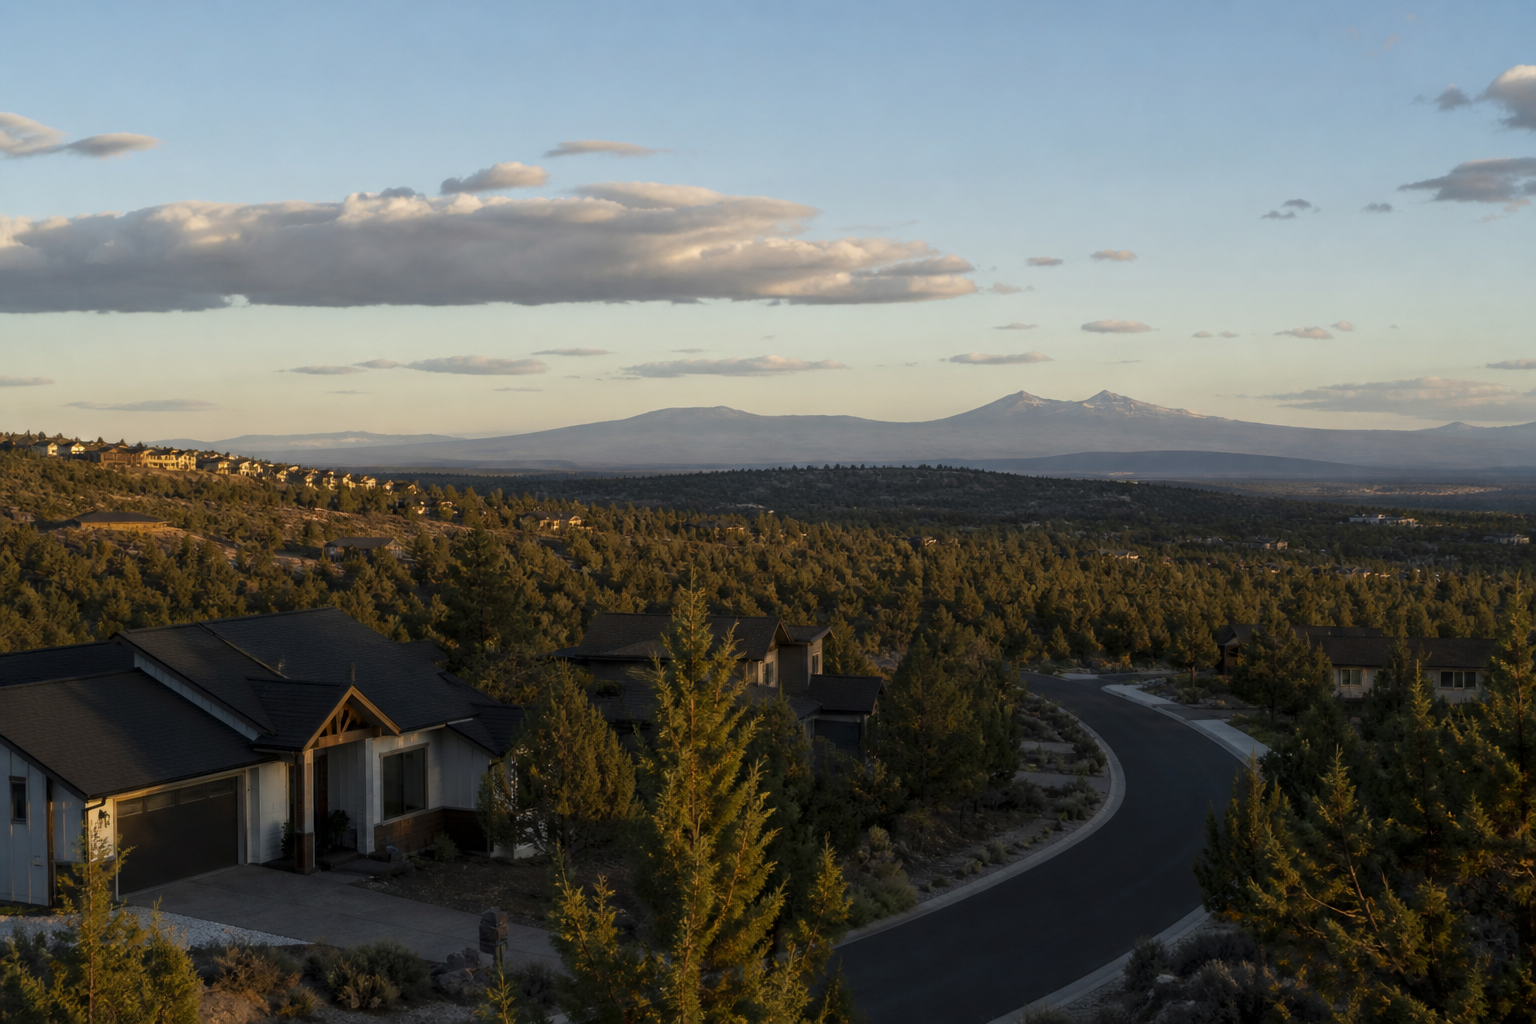 Larkspur$650,000 median list32 active
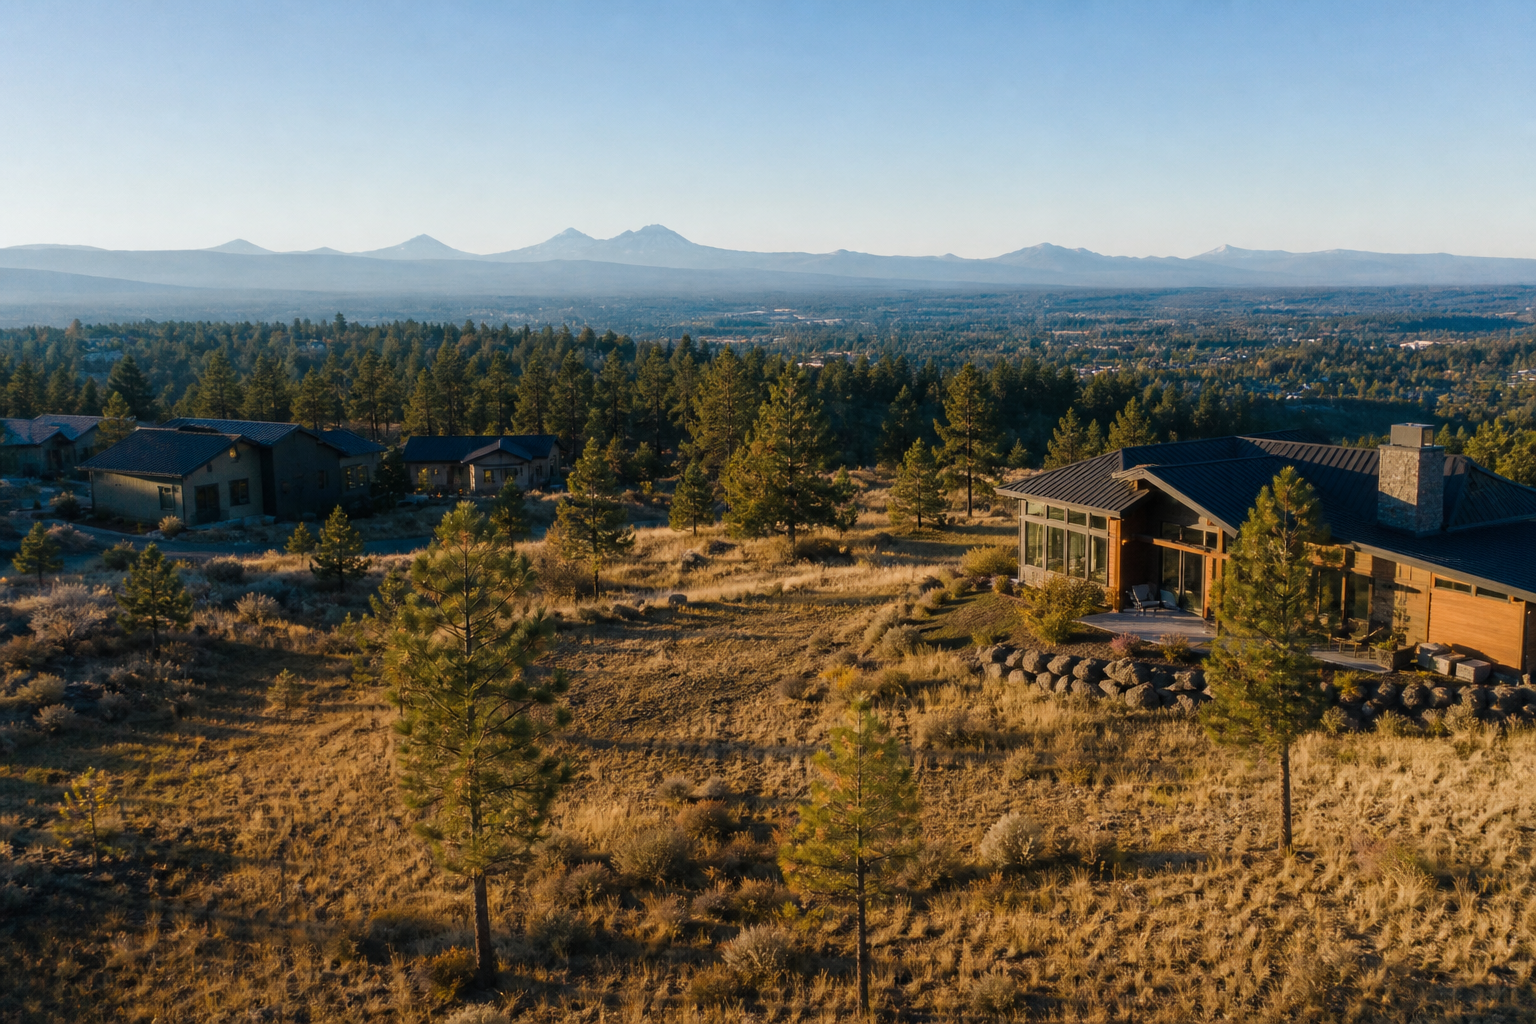 Mountain View$603,750 median list48 active
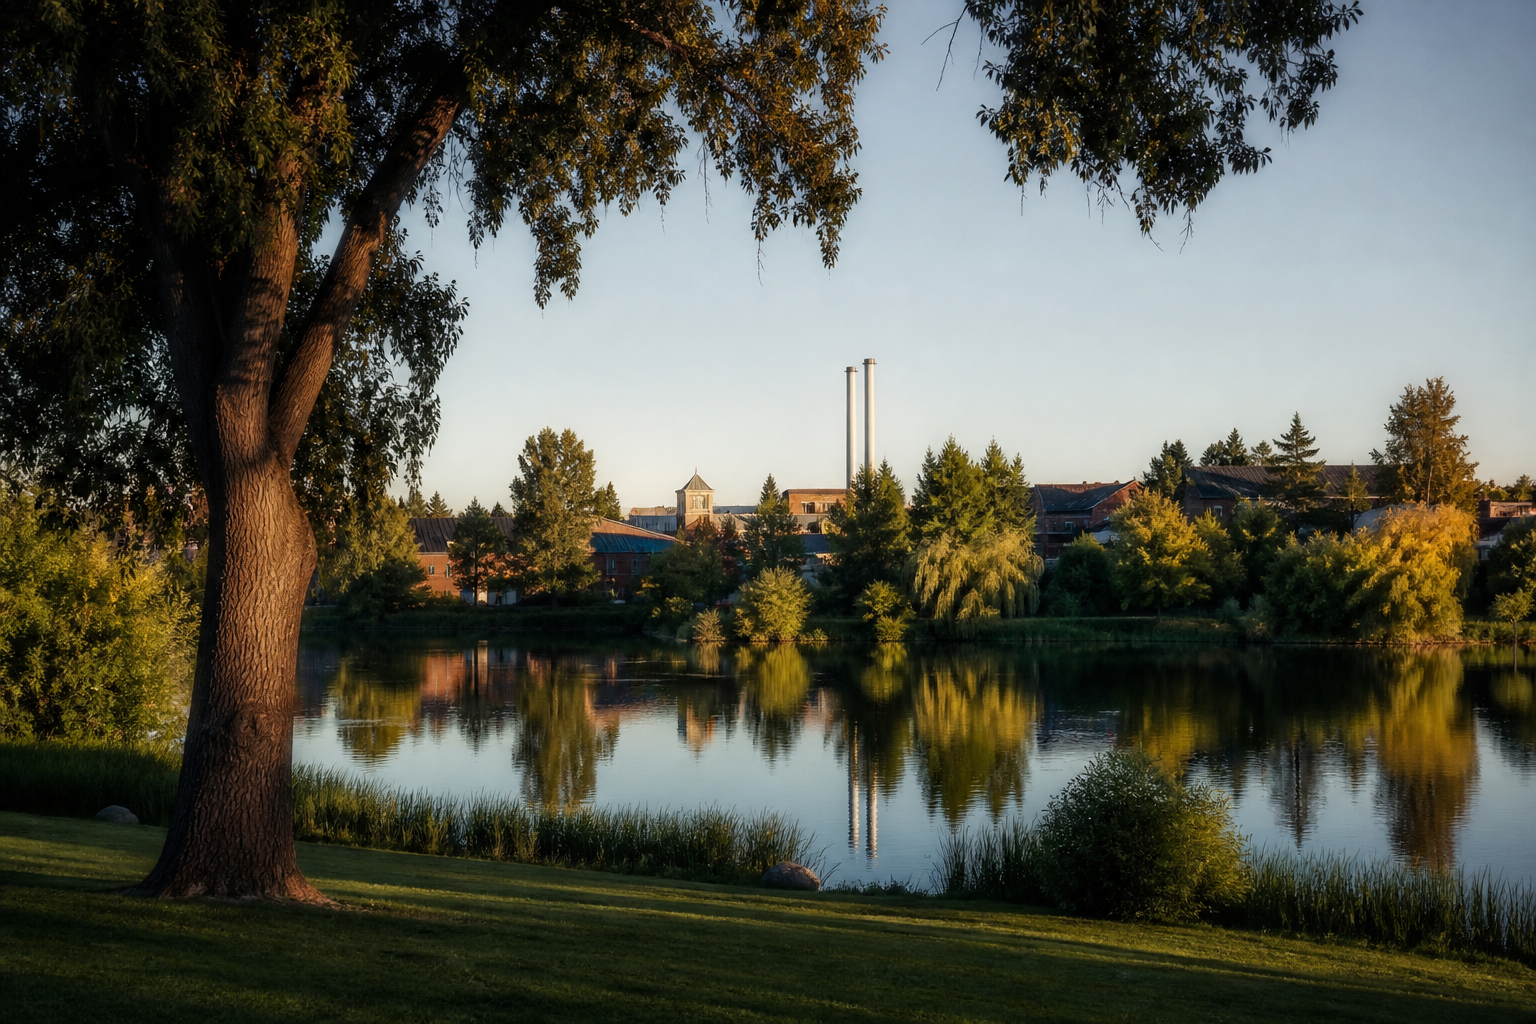 Old Bend$1,109,500 median list6 active
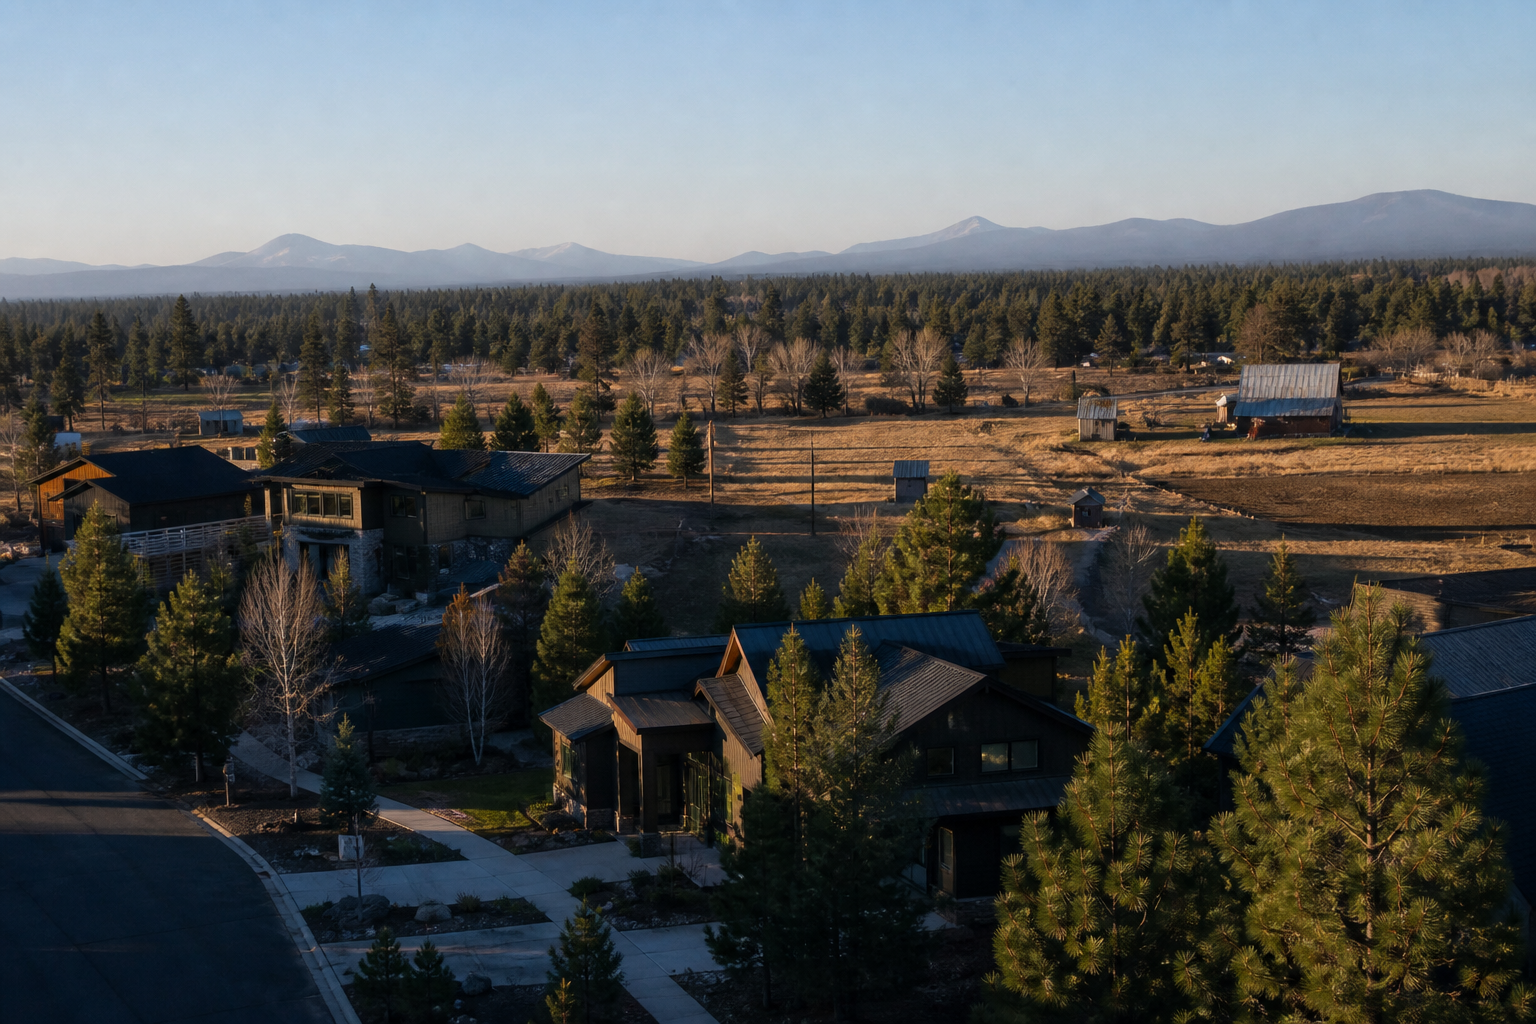 Old Farm District$624,990 median list55 active
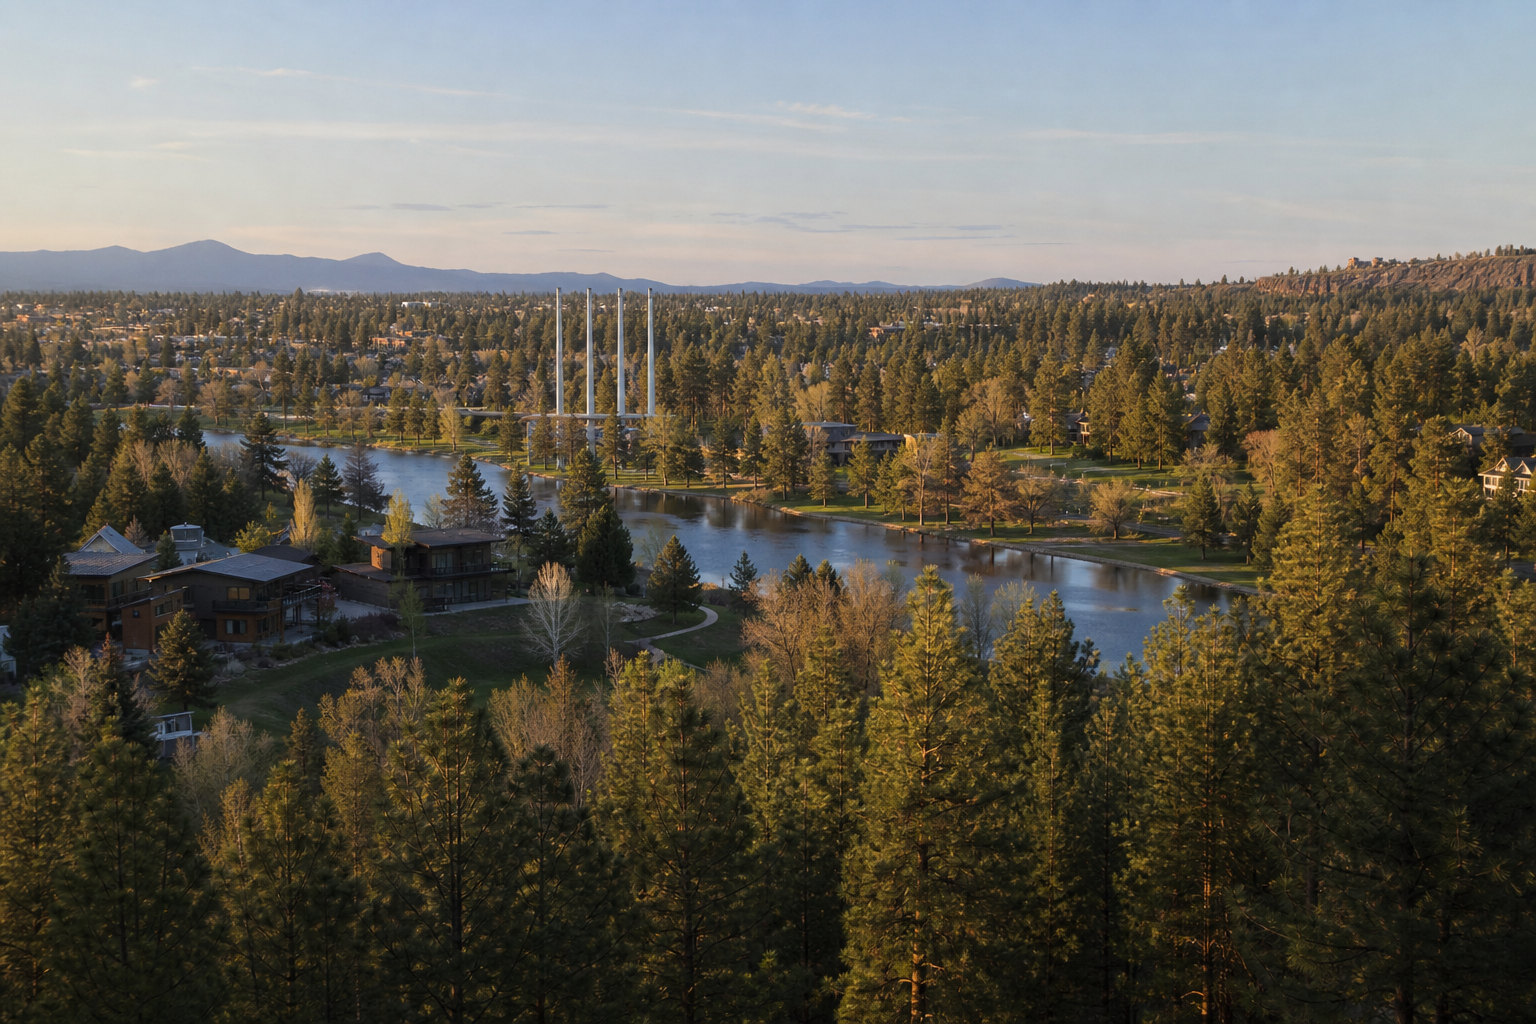 River West$1,125,000 median list25 active
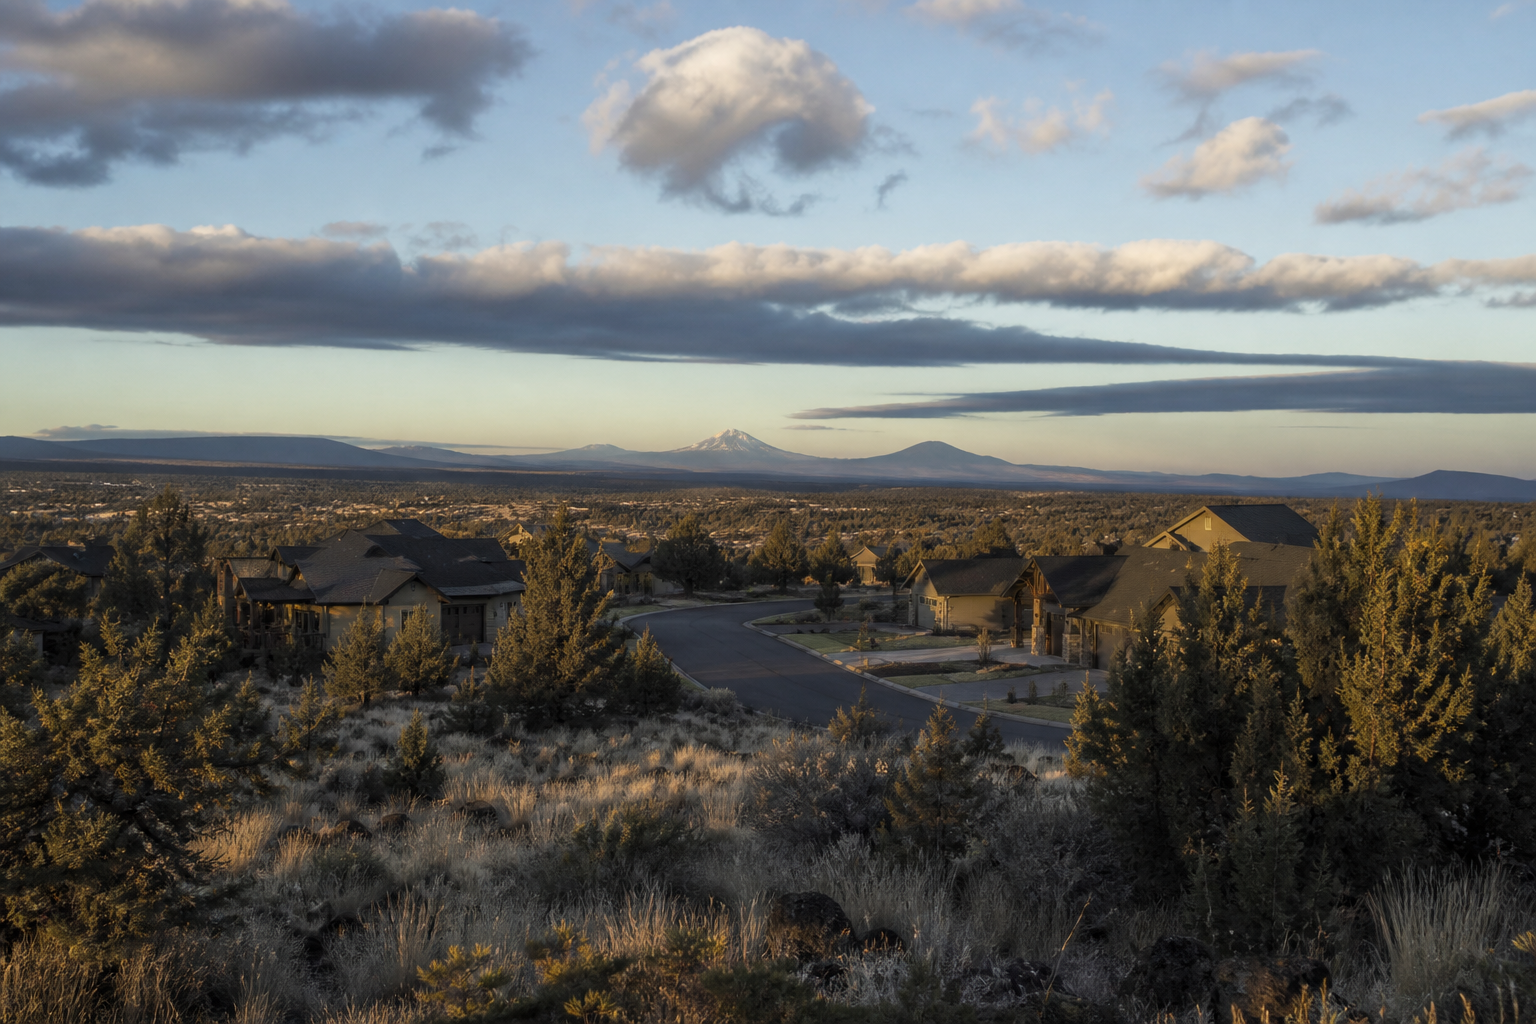 Southeast Bend$749,450 median list20 active
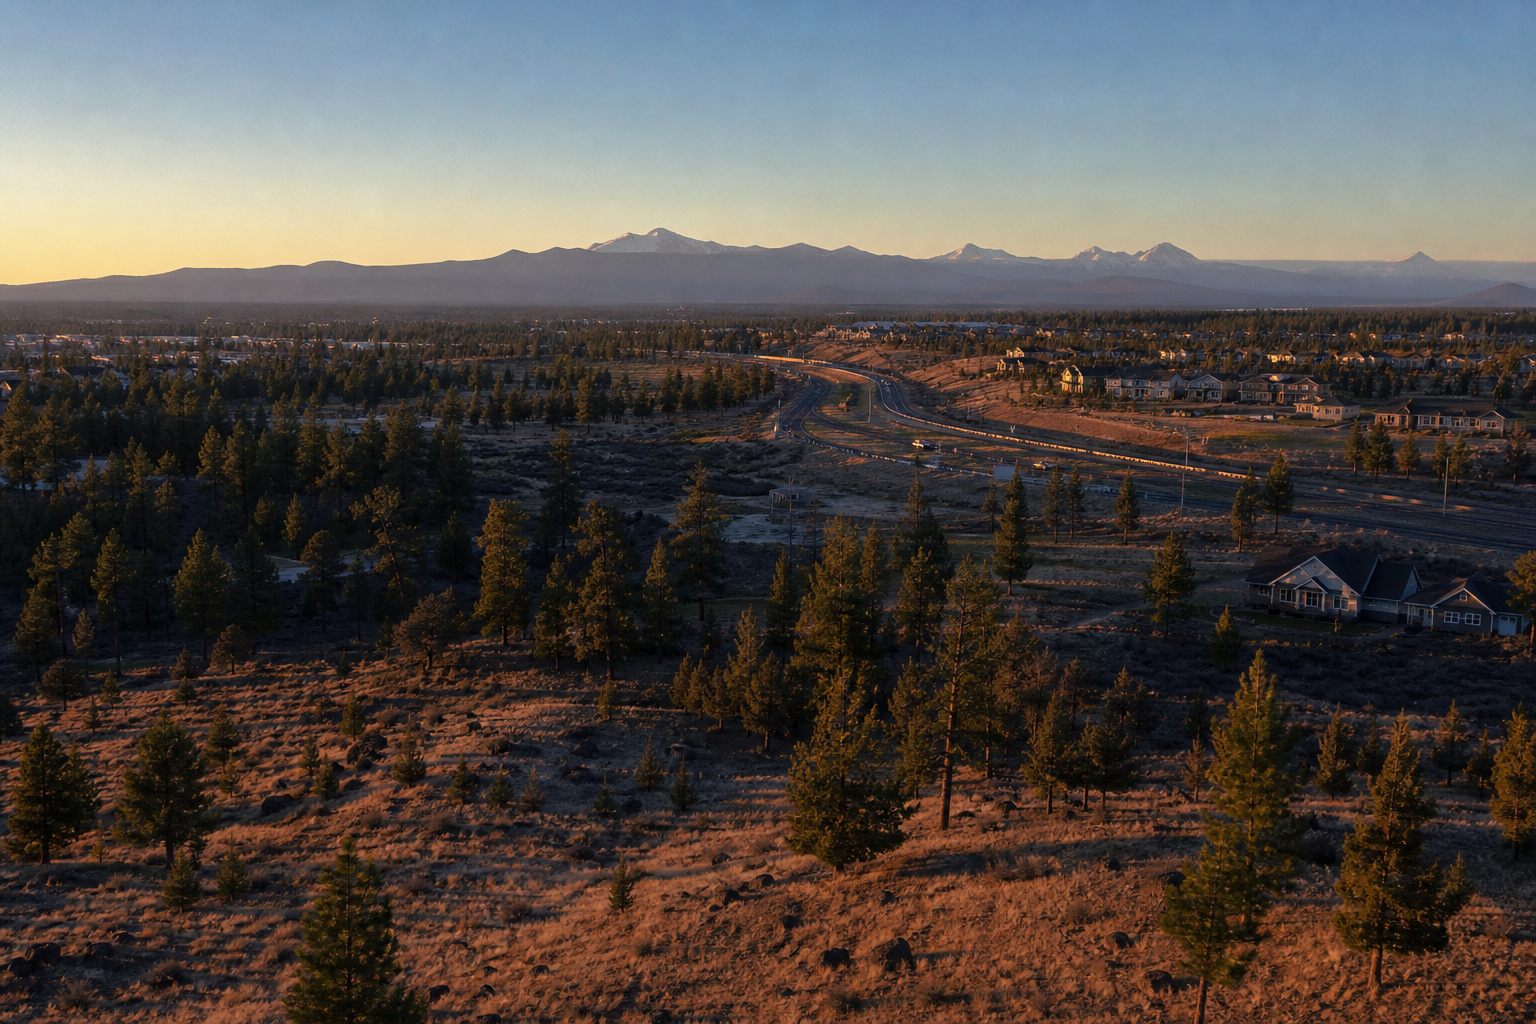 Southern Crossing$759,900 median list7 active
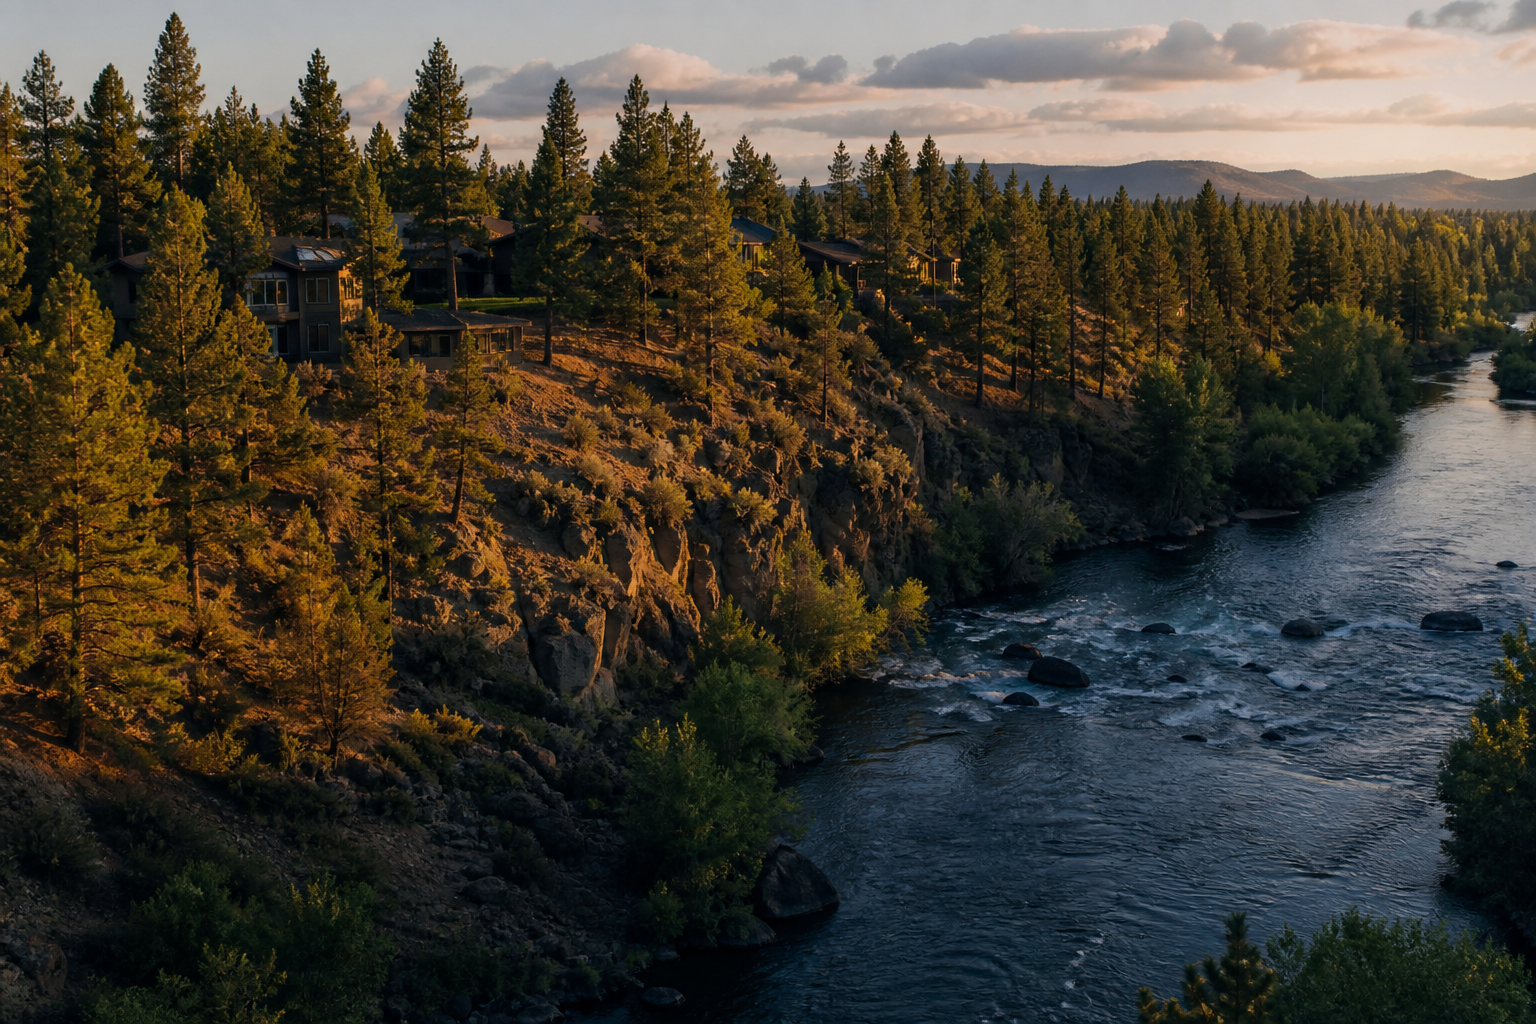 Southwest Bend$727,000 median list33 active
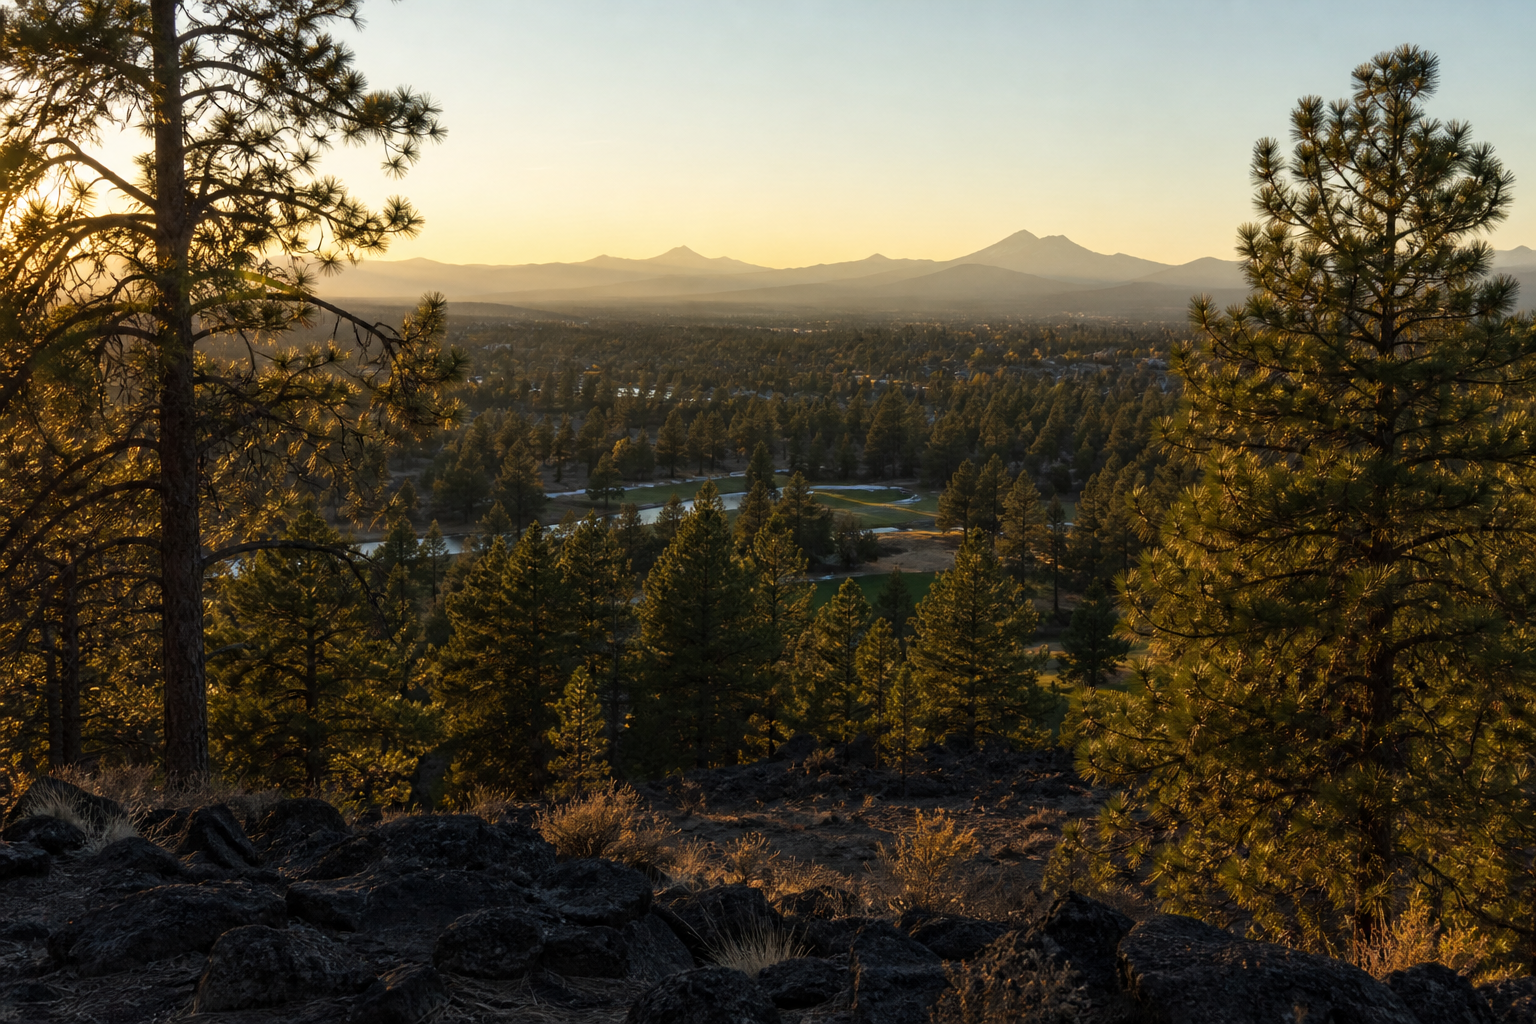 Summit West$1,499,900 median list81 active
live MLS through Oregon Data Share, active single-family listings, counted per place
Orchard District · Explore
Central Oregon
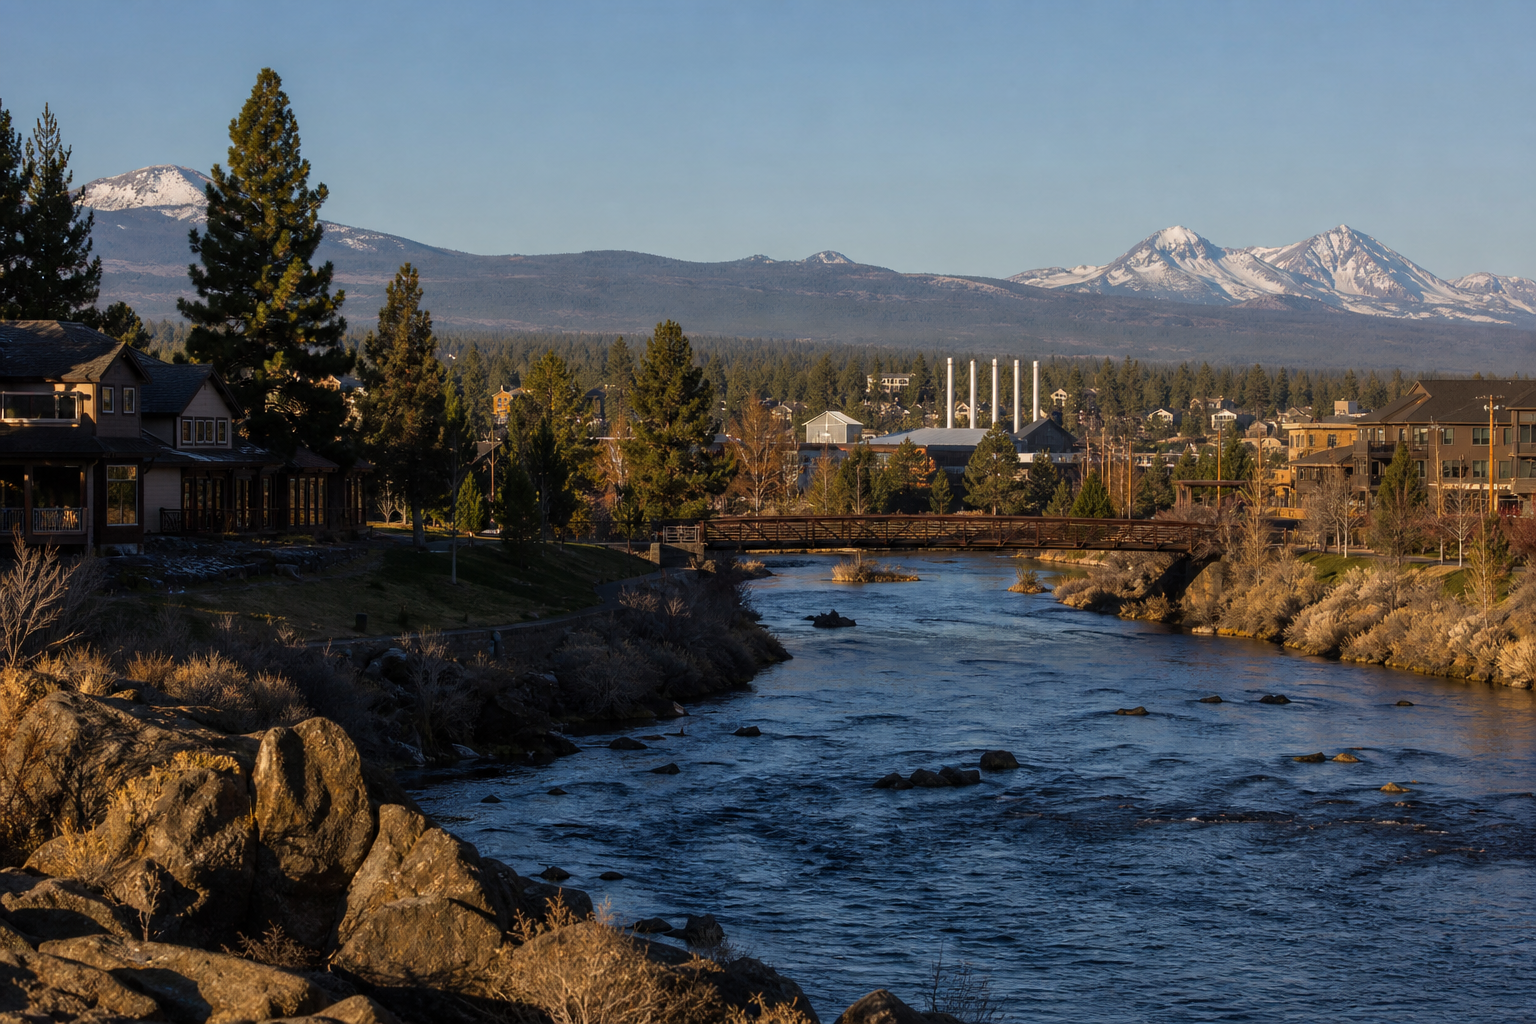 Bend$950,000 median list625 active
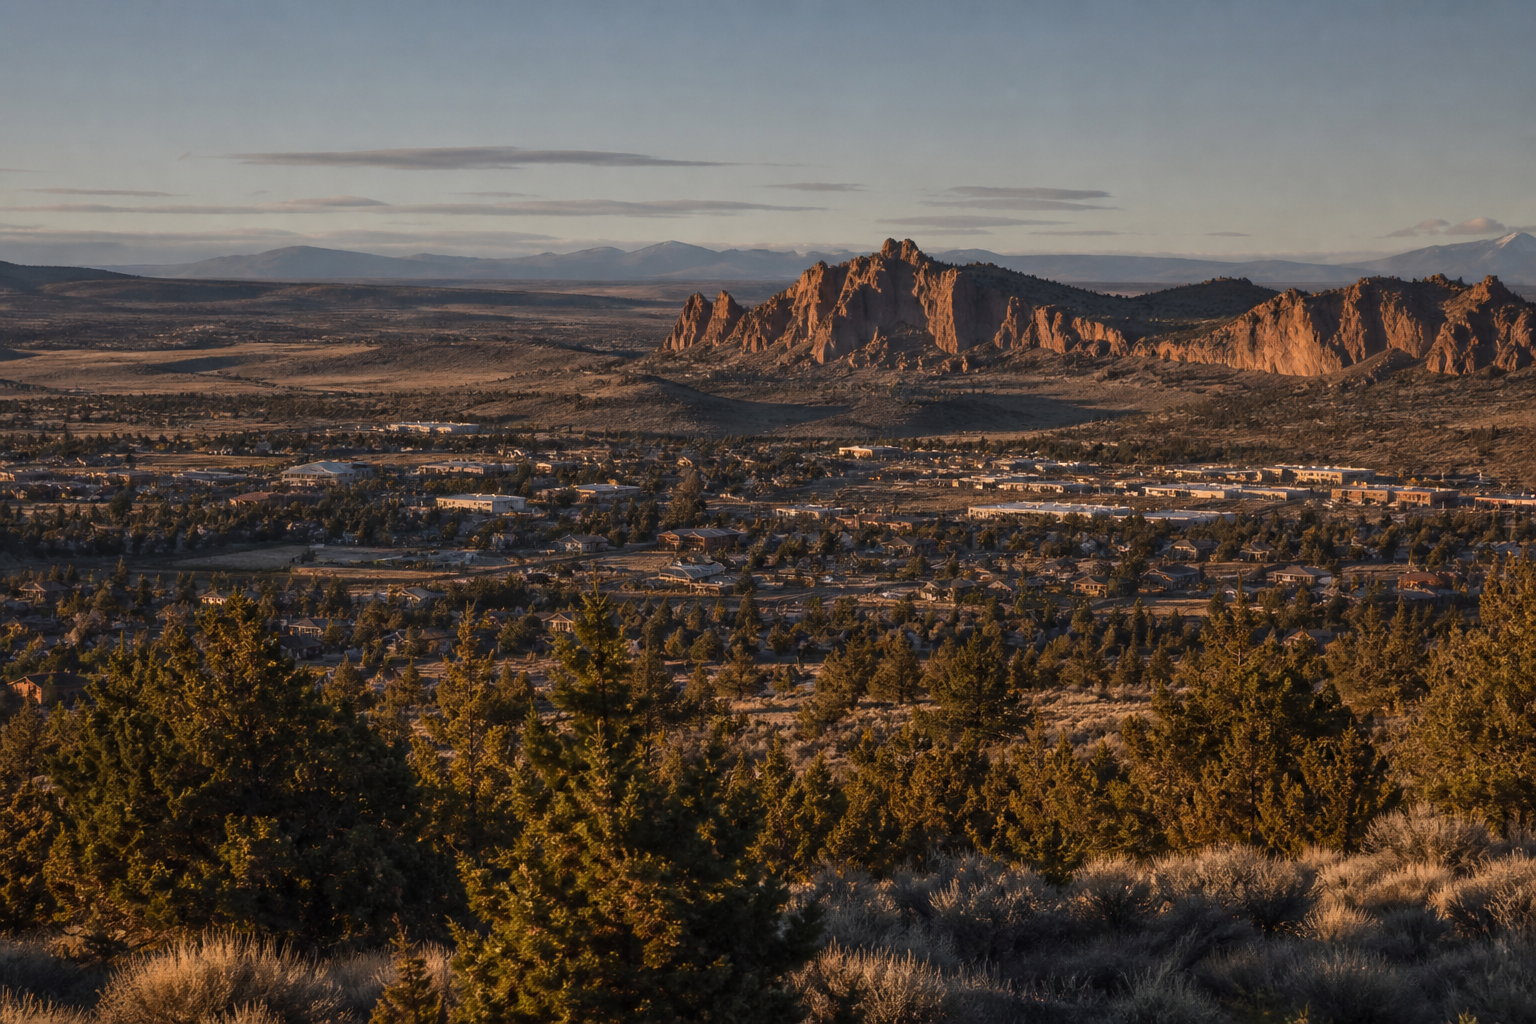 Redmond$599,950 median list214 active
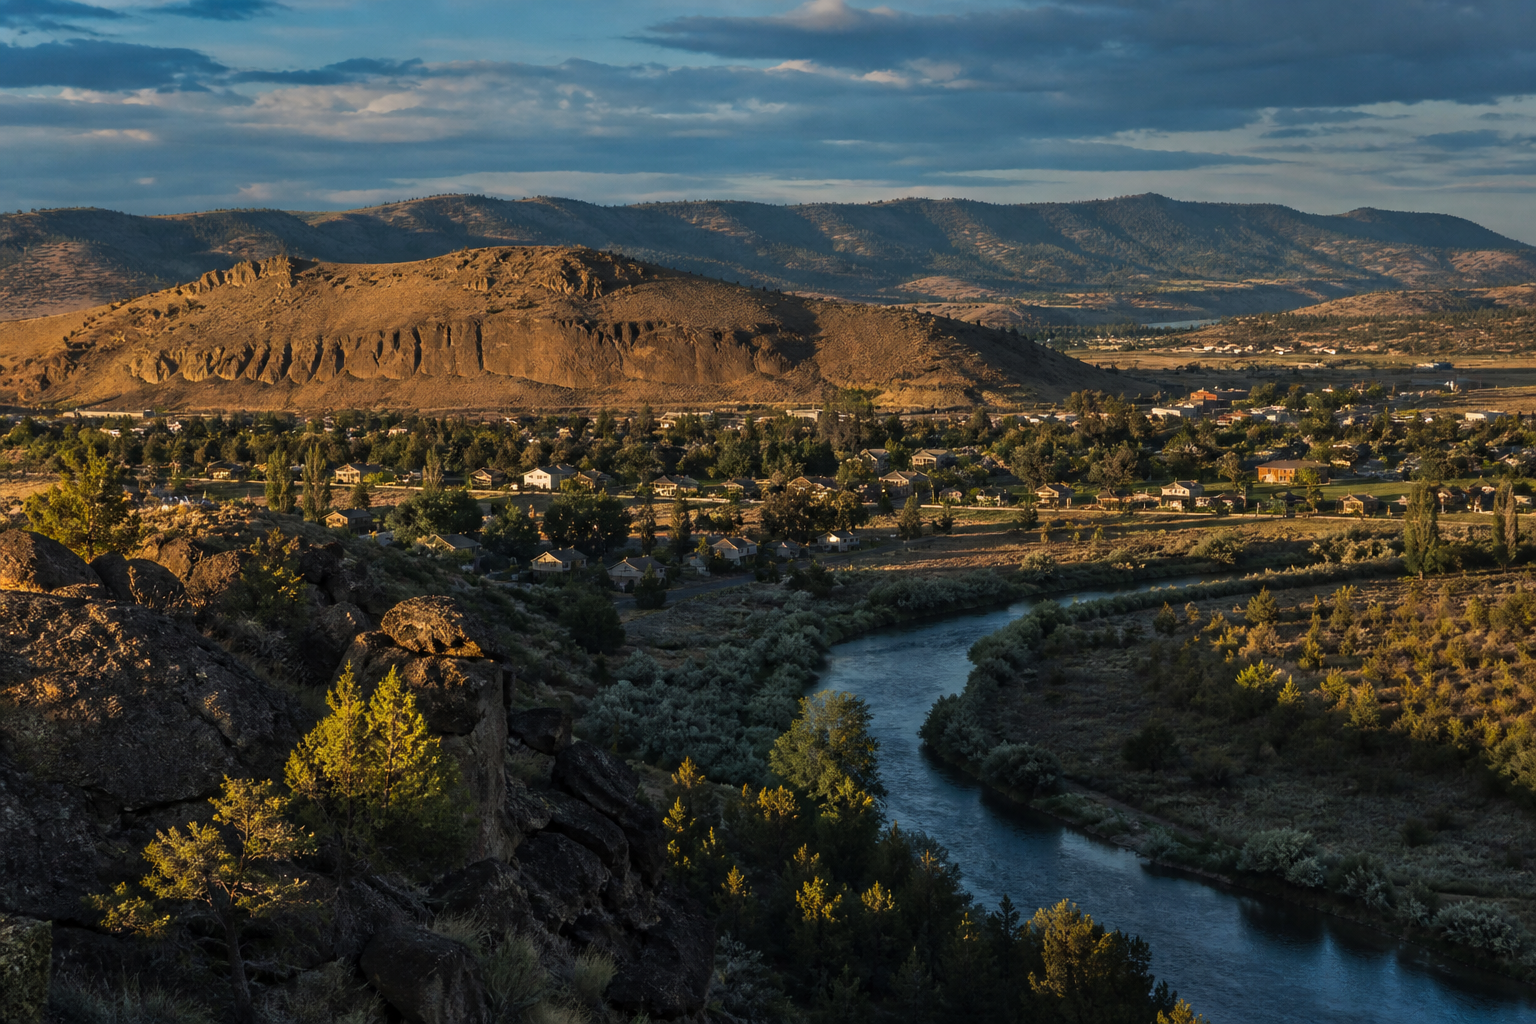 Prineville$517,000 median list156 active
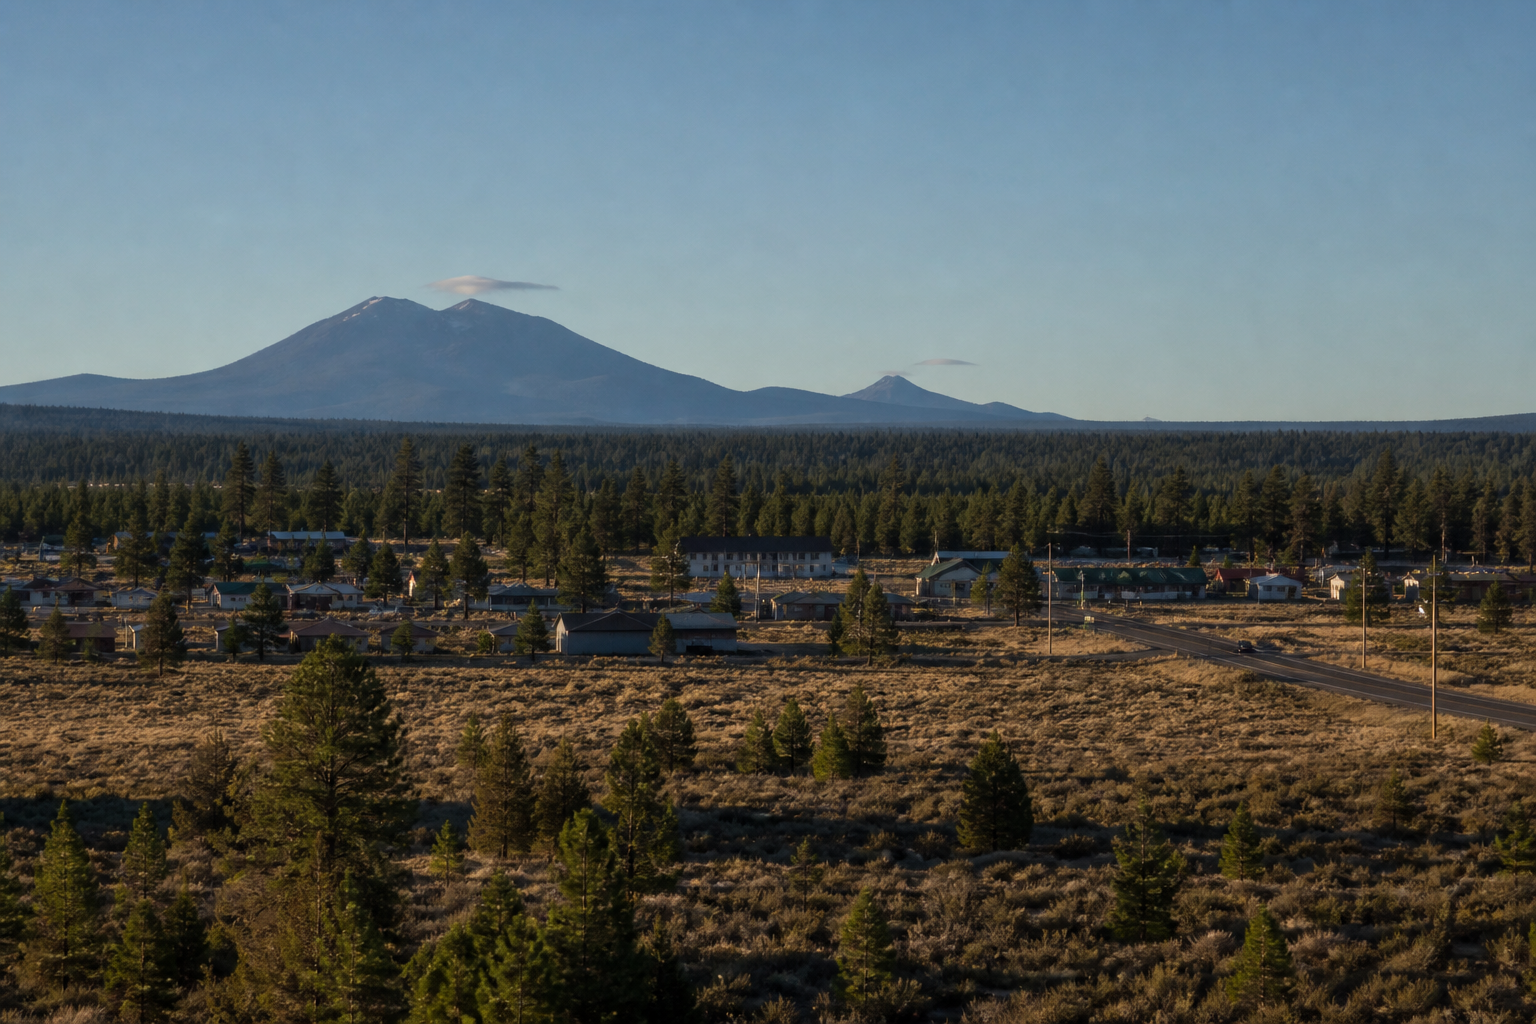 La Pine$499,700 median list146 active
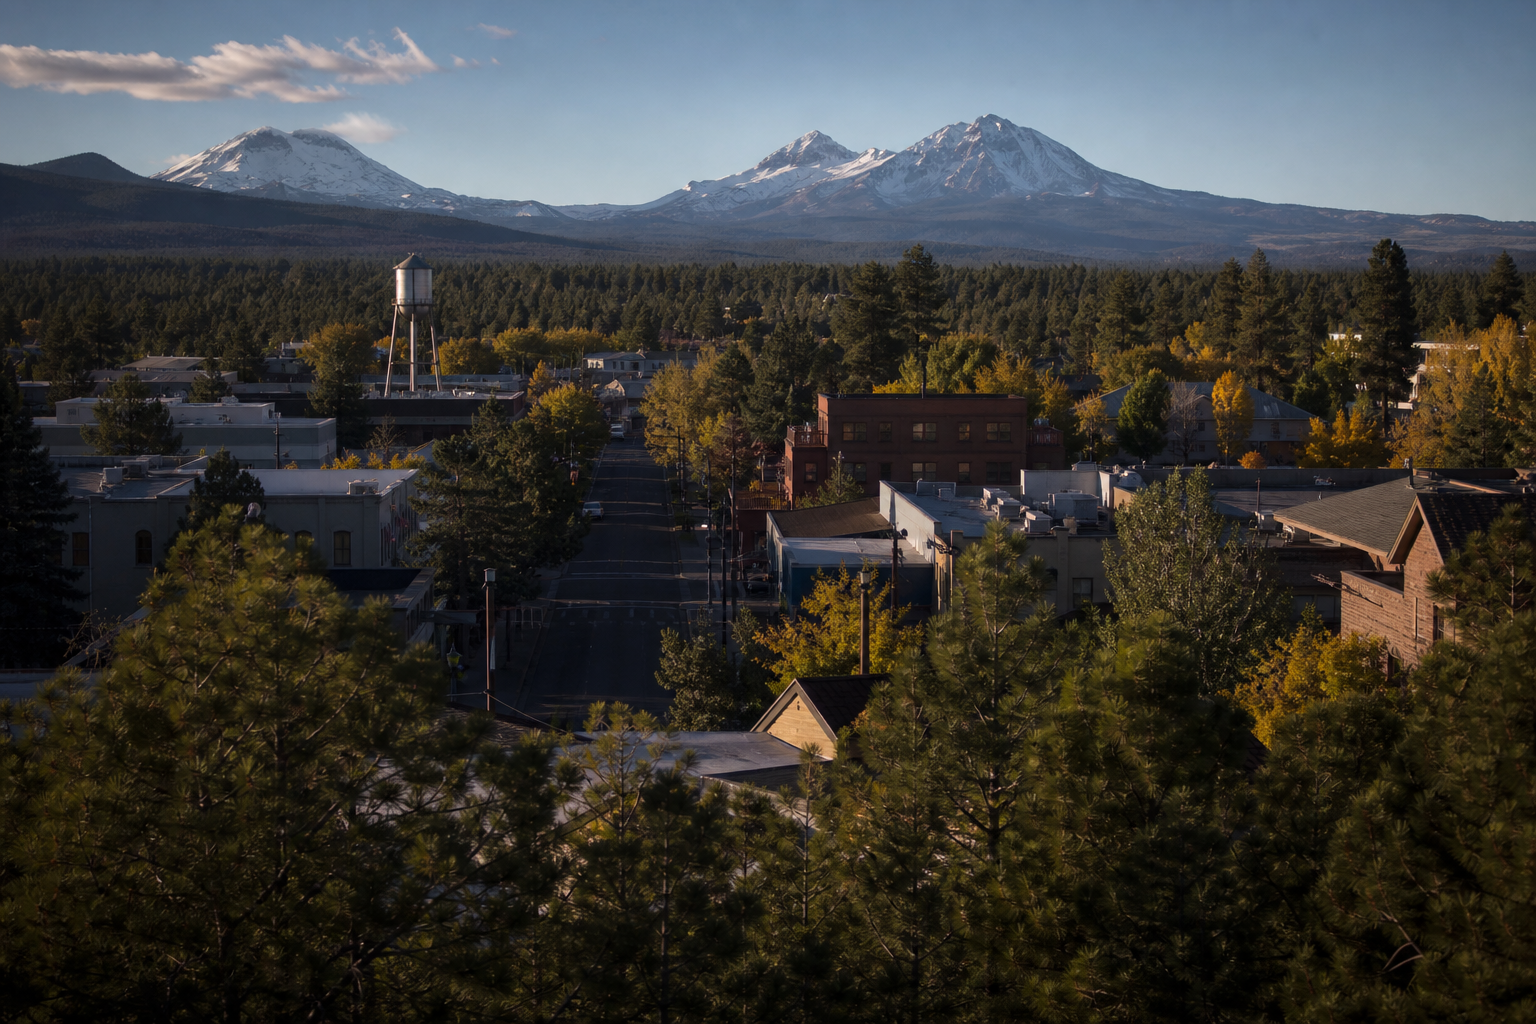 Sisters$899,000 median list94 active
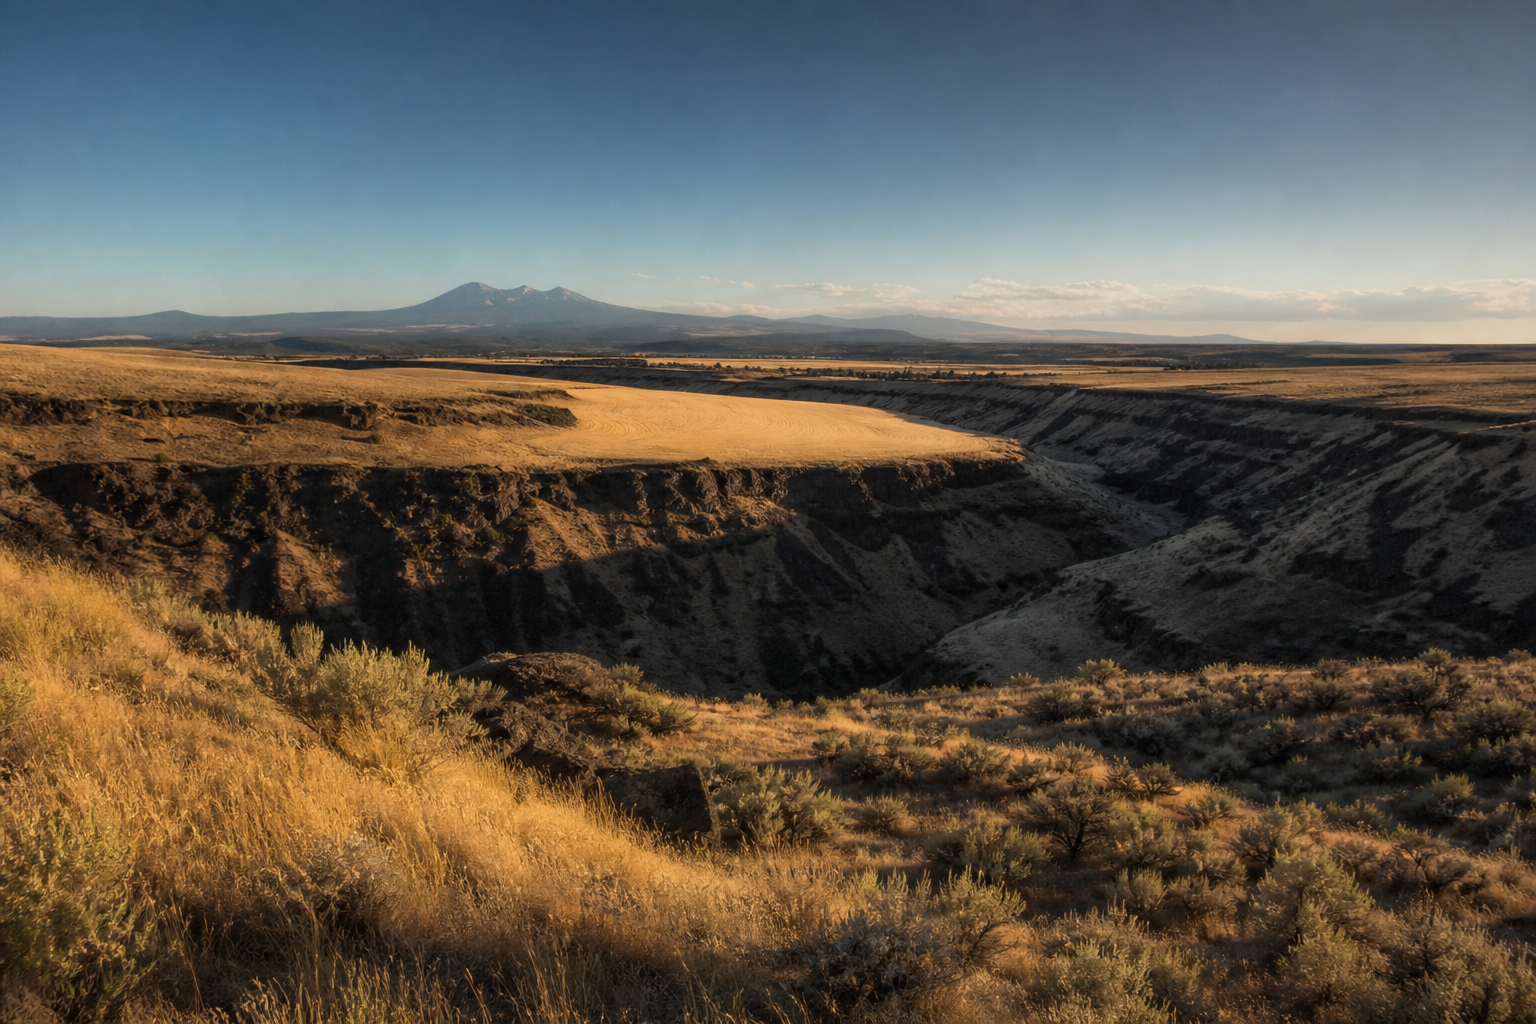 Madras$462,000 median list68 active
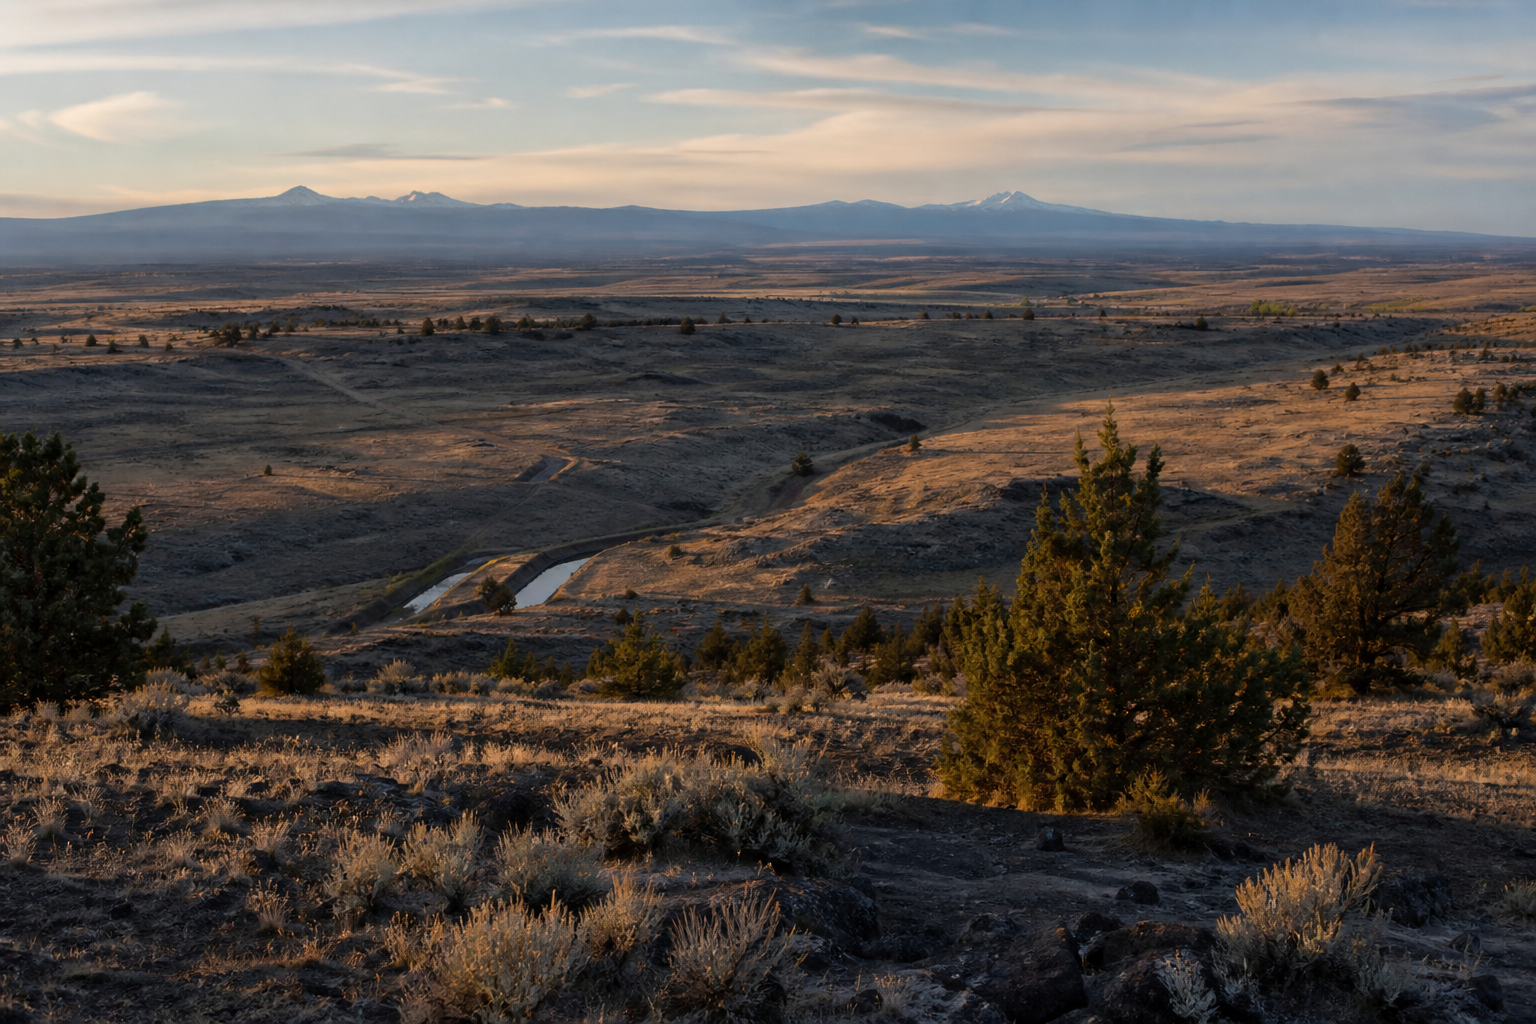 Powell Butte$1,347,250 median list54 active
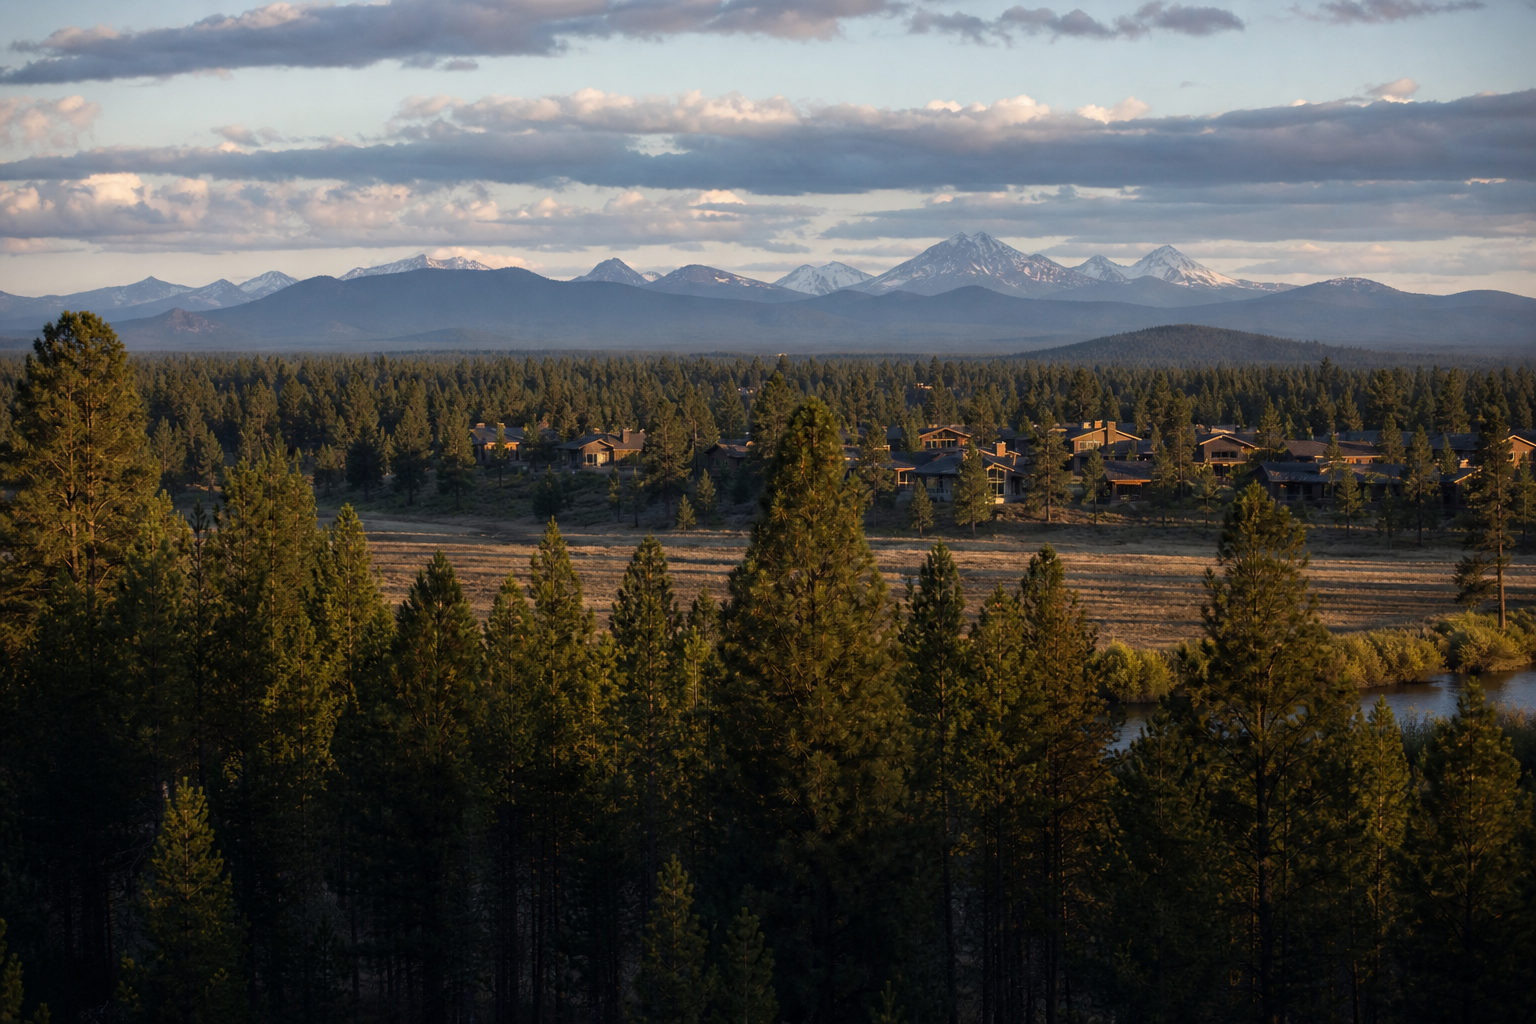 Sunriver$869,498 median list48 active
live MLS through Oregon Data Share, active single-family listings, counted per place


