Overview
The US housing market has been stuck in low gear for four years now. Since 2022, existing home sales have averaged roughly 4.3 million annually. To put that in perspective, that is the lowest sustained volume we have seen since the mid 1990s, excluding the Great Recession crash and the brief 2020 COVID lockdowns.
For context, the normal long term average from 1989 to 2019 was about 5.3 million sales per year. We are missing a million moves a year.
Normally, when volume collapses this hard, prices drop. Instead, home prices have climbed roughly 6% nationally over that same period. This unusual dynamic where falling sales pairs with rising prices happens when supply is frozen and demand is choked simultaneously. Sellers are not listing, and buyers cannot afford to jump in. The result is not a bubble or a bust but a stalemate.
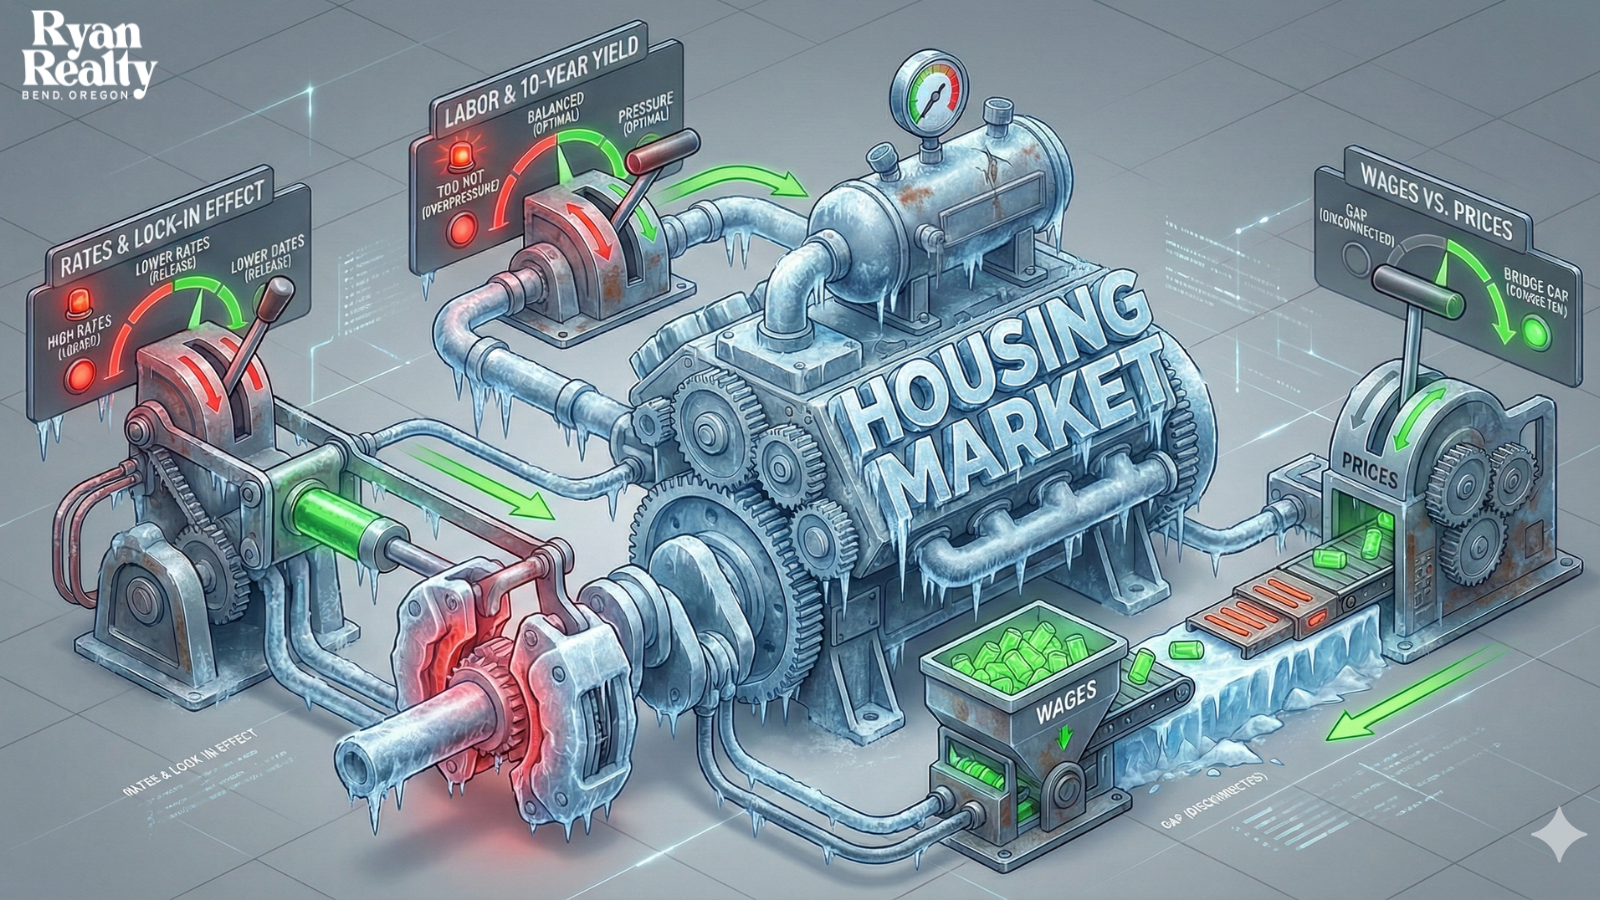
As we look at 2026, we need to ignore the headlines and look at the mechanics. There are three core drivers that will determine if this market finally moves: mortgage rates, the labor market, and the gap between wages and prices.
1. Mortgage Rates and the Rate Lock Effect
This is the supply constraint. Millions of homeowners secured mortgage rates between 2% and 3% during 2020 and 2021. Today, with rates hovering around 6.2%, trading a 3% rate for a 6% rate means doubling your interest payment for the same loan amount.
This financial penalty keeps inventory historically low because discretionary sellers are simply staying put. The market cannot return to normal volume until this rate lock effect cracks, either through rates dropping into the 5% range or life events forcing people to move regardless of the cost.
2. The Labor Market and the 10 Year Treasury
This is the engine of mortgage rates. Mortgage rates do not follow the Fed Funds Rate directly; they track the 10 Year US Treasury yield.
Strong Jobs equal High Rates: When the jobs market is resilient, the 10 Year yield stays elevated (currently in the 4.1% to 4.2% range). Investors bet on economic growth, which keeps mortgage rates high.
Weak Jobs equal Lower Rates: If the labor market softens, for example if the unemployment rate ticks up from its current 4.6% toward 5%, investors flock to bonds for safety. This pulls yields down toward 3.5% to 3.75%, which is exactly what we need to see mortgage rates drop.
Ironically, for housing affordability to improve via lower rates, we likely need the economy to get slightly worse.
3. Wages vs Home Prices
This is the ultimate affordability barrier. Since 2019, median household income has risen roughly 18% to 20% (to roughly $82,000). However, median home prices have surged over 45% (crossing $400,000).
Until this gap narrows, either through significant wage growth or a correction in home prices, first time buyers remain sidelined.
What The Experts Are Predicting for 2026
I am not an economist, but I follow the people who are. Two distinct forecasts from leading analysts illustrate how these three levers might play out this year.
The Soft Landing Case (Logan Mohtashami, HousingWire): Logan outlines a base case of slow labor softening. He expects the 10 Year yield to drift lower, pushing mortgage rates into the 5.75% to 6.75% range by late 2026. This would crack the rate lock effect, boosting sales modestly, with prices still up 4% to 6%.
The Great Stall Case (Dave Meyer, BiggerPockets): Dave sees rates easing modestly but not enough to unlock inventory fully. With wages lagging and affordability strained, he predicts prices flat or down 1% to 2% nominally. Sales might edge up slightly, but the market remains muted.
The Black Swan Risks
Both forecasts above assume a relatively stable path. However, rare events could upend everything. Two specific risks to watch in 2026 include:
A Sudden Financial Shock: If large financial institutions run into trouble because they borrowed too much money, lenders get scared. When lenders are scared, they protect themselves by charging much higher interest rates to everyone—including regular homebuyers. This could send mortgage rates spiking up instantly, even if the Federal Reserve is trying to keep them low.
The Insurance Crisis: You cannot get a mortgage without home insurance. We are already seeing insurers stop covering areas prone to wildfires or severe storms. If insurance companies decide to stop writing policies in a specific neighborhood or region, buyers cannot get loans to buy homes there. If buyers can't get loans, sales stop completely, and home values drop.
The View from Central Oregon
For those of you reading this from Central Oregon, our market generally tracks these national trends but with a few local twists. We have seen steady pricing similar to 2025, with modest appreciation continuing.
However, our local economy is driven by tourism, outdoor recreation, and a maturing tech scene. This often creates a resilience that other markets lack. Inventory here tends to turn over slightly faster than the national average because our buyers are often lifestyle driven, moving here for the mountains and community rather than just pure economic necessity.
Looking Ahead
While the data highlights challenges, there is plenty of reason for optimism in 2026.
Real estate is a long game. The "perfect time" to buy is rarely when the headlines say so; it is when your personal finances and life goals align. We are seeing more negotiation power for buyers now than in previous years, and sellers are finally adjusting expectations. The stalemate is beginning to loosen. For those who are prepared, educated, and patient, this market offers a rare window to buy without the frenzy of bidding wars.
The American Dream of ownership is still very much alive. We are just navigating a new path to get there.
Sources and Data Tracking
Logan Mohtashami (HousingWire): HousingWire Author Page
Dave Meyer (BiggerPockets): BiggerPockets Blog Profile
Employment Data: BLS Employment Situation
Interest Rates: FRED 10 Year Treasury Series
Housing Sales Volume: NAR Existing Home Sales Data
Wage Growth: Atlanta Fed Wage Growth Tracker
Check out this article next